Skip to content

Towards Open Science

  • Research Highlights
  • Publications
  • Videos
  • Testimonials for Ganesh Mallya
  • About
  • Blog or Home page
  • Search

Towards Open Science

  • Search
  • Research Highlights
  • Publications
  • Videos
  • Testimonials for Ganesh Mallya
  • About
  • Blog or Home page
Relation between temperature, precipitation, and weather day

West Lafayette Weather Visualization

In this blog post, interactive and static visualizations of weather data during the ...

Read more »
Moody Diagram Friction Factor

Moody's Friction Factor Calculator

Friction factor is used when calculating head loss due to friction (i.e. Darcy’s ...

Read more »
December 2018 Daily Average Air Temperatures

December 2018 Air Temperatures

Today, we will take a glance at the December 2018 Air Temperatures in West Lafayette, ...

Read more »
Visualizing Google Trends Data - Most Popular Cookies in the USA

Visualizing Google Trends Data

I was working on a water quality project over the past few days, and the results ...

Read more »
Ganeshchandra Mallya

About

I am currently at the Lyles School of Civil Engineering, Purdue University working in the area of Hydrology and Hydraulics.

Read more »
citations for ganesh mallya

Publications

Contains a list of journal articles, conference & poster presentations, book chapters, and news/magazine articles published/presented based on some of my work.

Read more »
Relation between temperature, precipitation, and weather day
Data Science Data Visualization

West Lafayette Weather Visualization


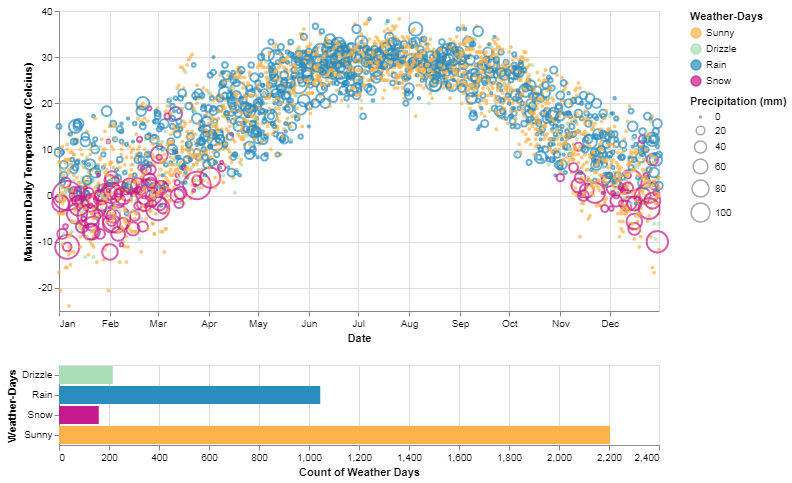
 In this blog post, interactive and static visualizations of weather data during the last 10 years over West Lafayette, IN, the home of Purdue University […]

by gmallya
Published June 9, 2020
Updated June 9, 2020
Moody Diagram Friction Factor
Tools

Moody’s Friction Factor Calculator


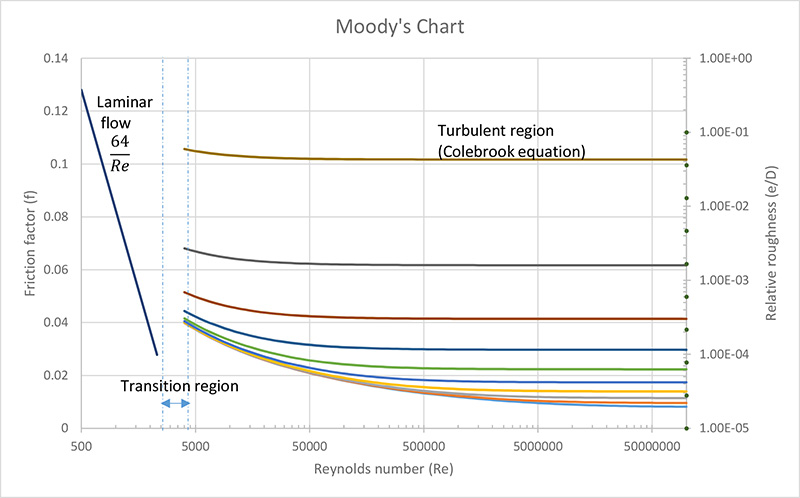
 Friction factor is used when calculating head loss due to friction (i.e. Darcy’s equation) in pressurized pipes or ducts. Moody’s Friction Factor Calculator Reynold’s number […]

  • Calculator
  • CSS
  • Friction factor
  • HTML
  • JavaScript
  • MATLAB
  • Moody Calculator
  • Moody chart
  • Moody diagram
  • Moody's
  • Moody's Calculator Online
  • Online friction factor calculator
  • Python
  • Reynolds number
  • Turbulent flows in pipe
by gmallya
Published October 31, 2019
Updated January 17, 2020
December 2018 Daily Average Air Temperatures
Climate change Data Visualization R R-Tutorial

December 2018 Air Temperatures


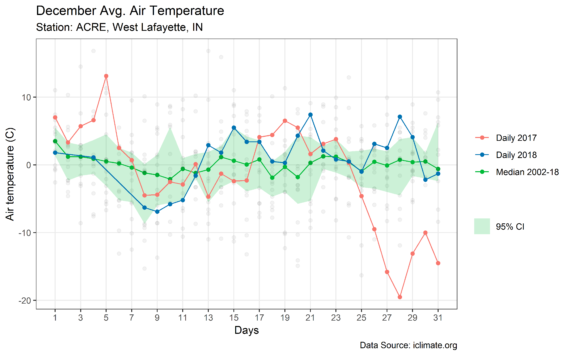
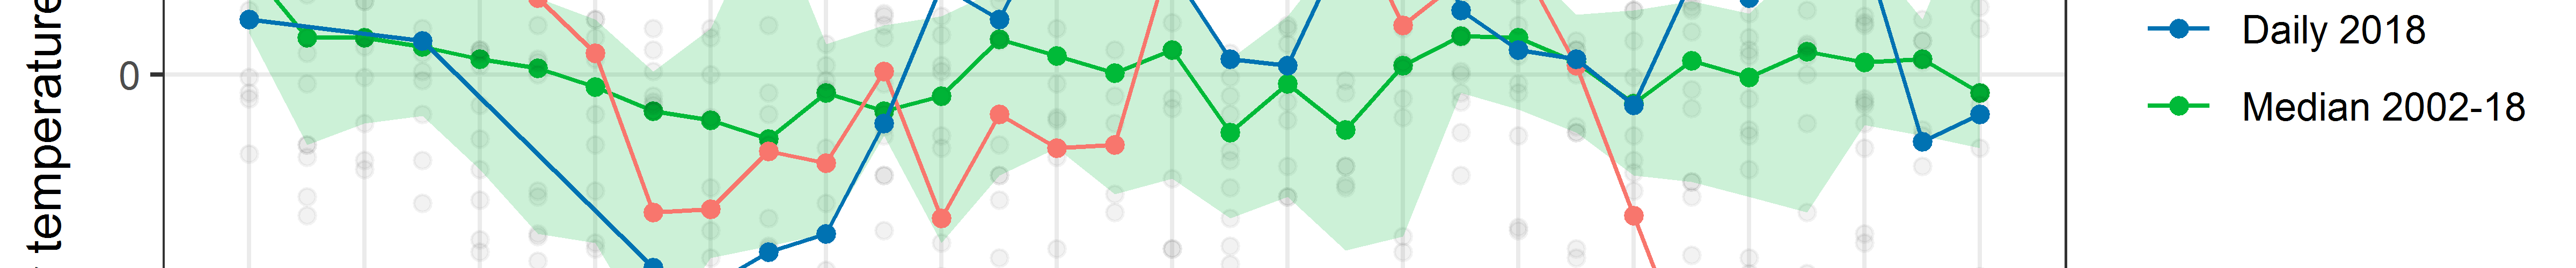
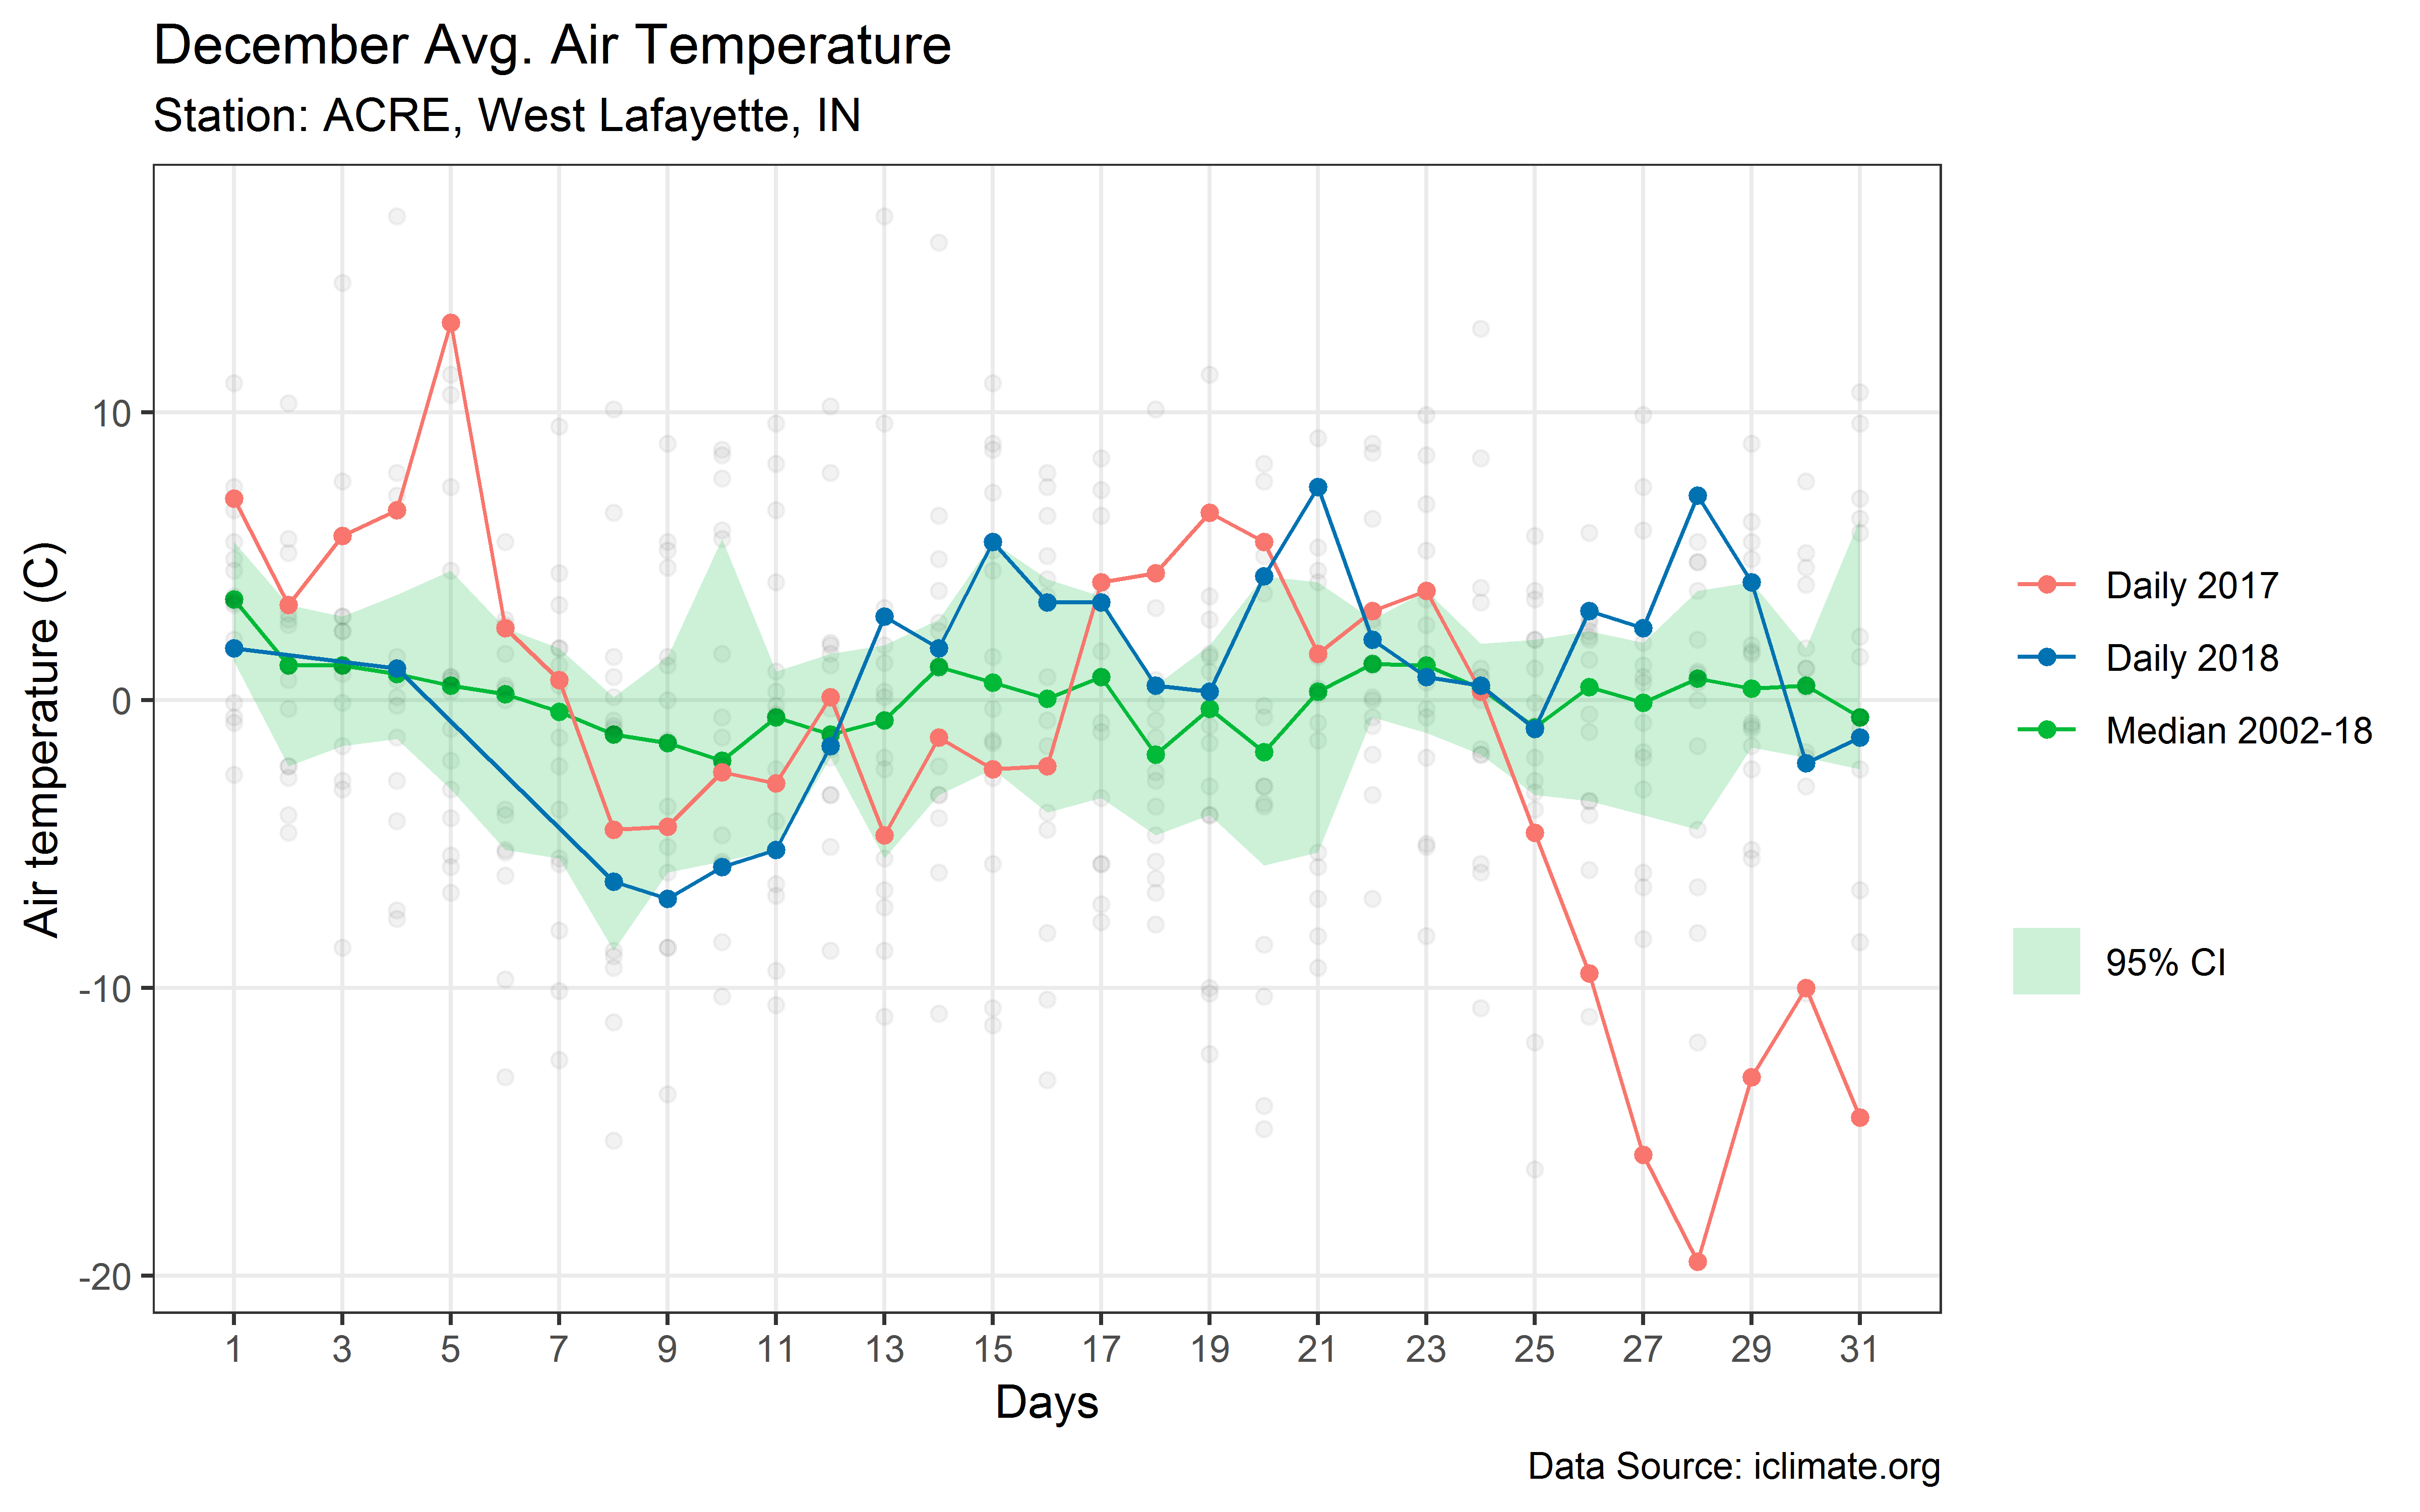
 Today, we will take a glance at the December 2018 Air Temperatures in West Lafayette, IN, the home of Purdue University. I have been living […]

  • air temperatures
  • Climate change
  • Data Science
  • data visualization
  • R
  • research
by gmallya
Published January 1, 2019
Updated January 4, 2019
Visualizing Google Trends Data - Most Popular Cookies in the USA
D3 Data Visualization Python

Visualizing Google Trends Data


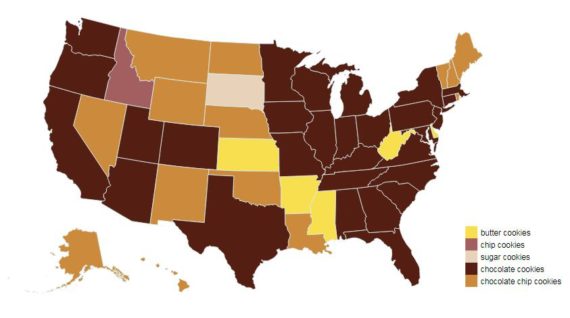
 I was working on a water quality project over the past few days, and the results I obtained were quite interesting. One thing led to […]

  • #d3js
  • #dataviz
  • Python
by gmallya
Published December 21, 2018
Updated December 21, 2018
Monthly Average Temperatures in Indiana, USA
Climate change D3 Data Science Data Visualization Research Tools

Visualizing Monthly Temperatures


 In the previous post, we looked at daily temperatures during November 2018 at the ACRE weather station in West Lafayette, IN. We then compared it […]

  • Climate change
  • D3
  • data visualization
  • Indiana
  • Monthly Temperatures
by gmallya
Published December 17, 2018
Updated December 17, 2018
Annual average temperature time series
Climate change Data Science Data Visualization Matlab R Research

November 2018 Air Temperatures


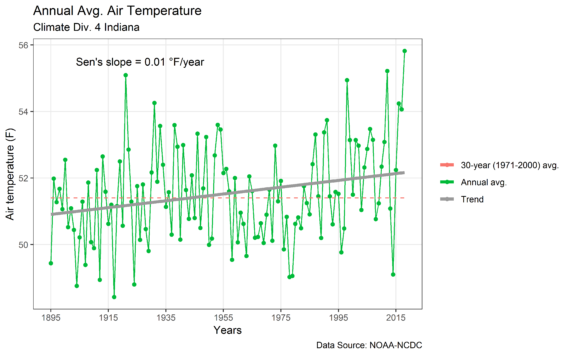
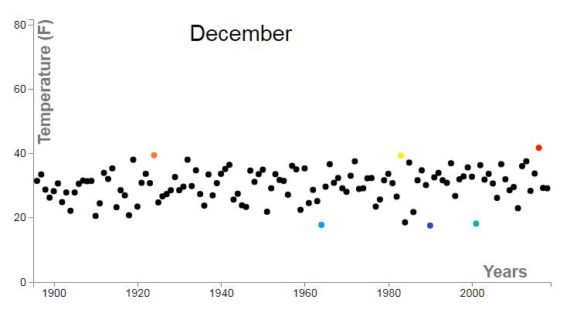
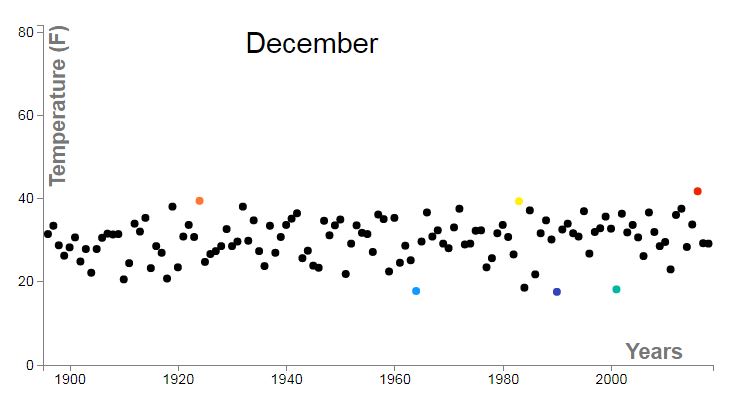
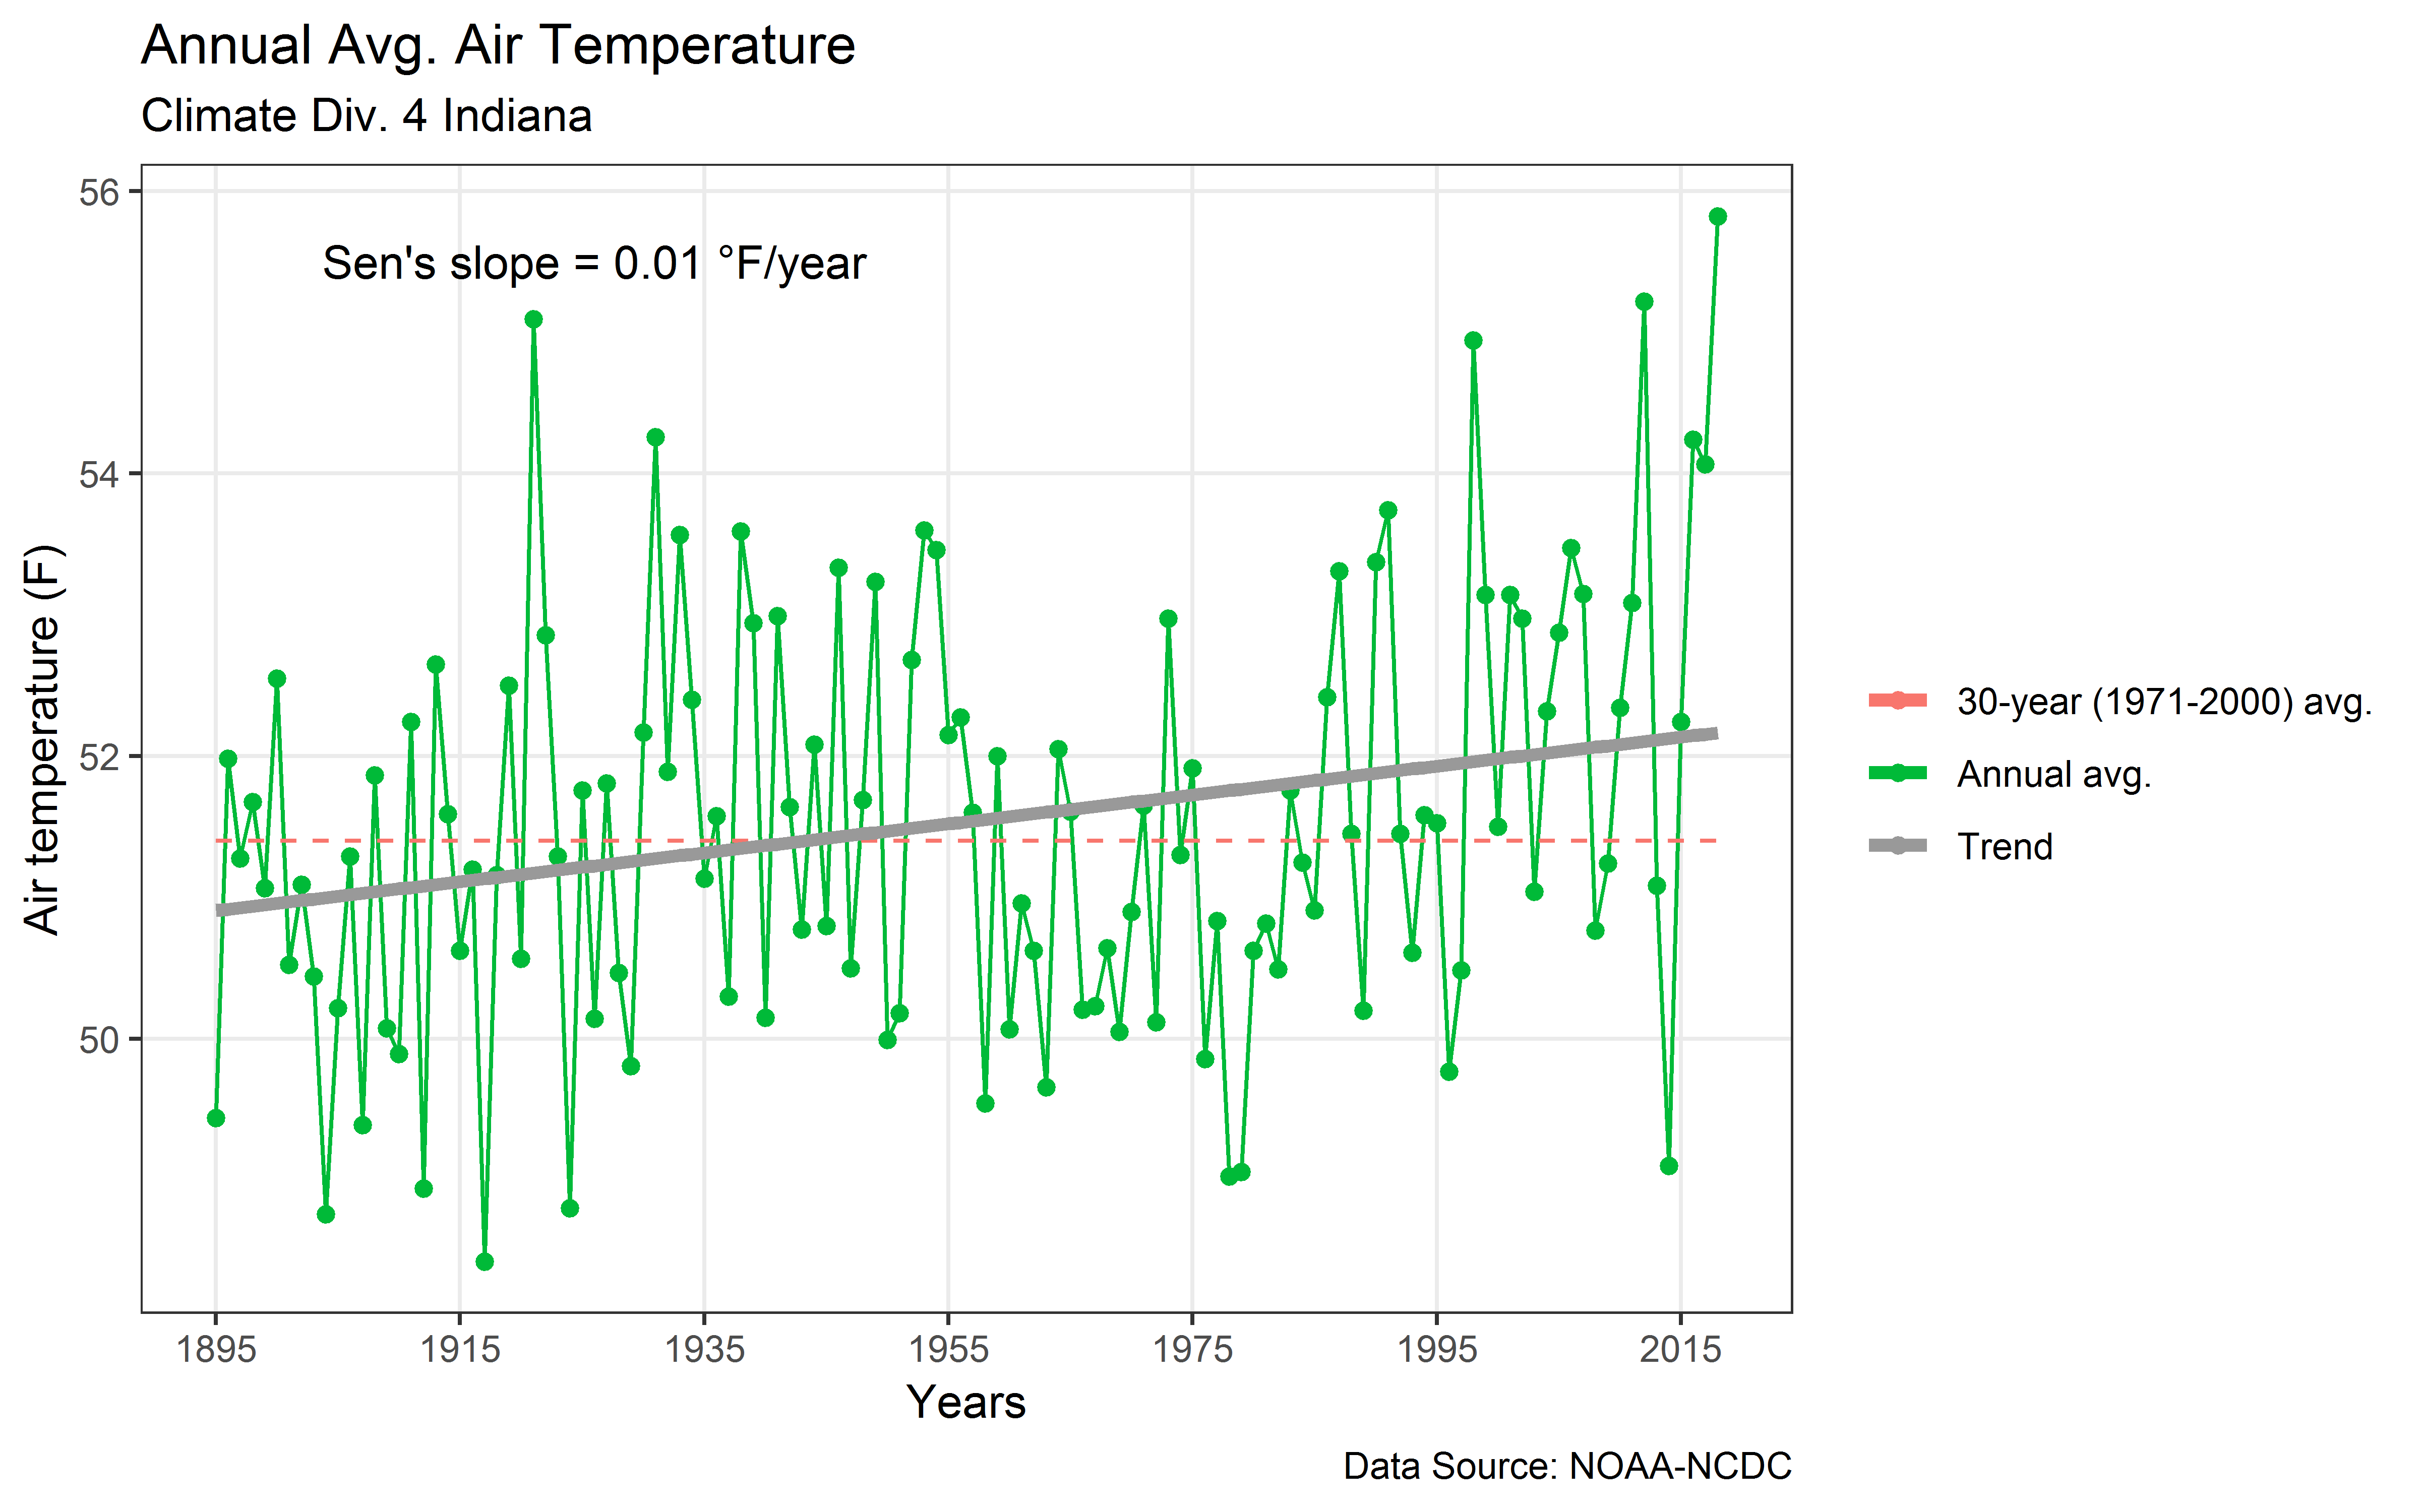
 Over the Thanksgiving weekend, there was a lot of buzz about global warming and climate change on Twitter thanks to politicians, media, and the public. […]

  • Data Science
  • data visualization
  • MATLAB
  • R
  • Temperature
by gmallya
Published November 29, 2018
Updated December 15, 2018
precipitation_time_series_hurricane_florence_02
Data Science R-Tutorial Research

Hurricane Florence – Read CSV files in R


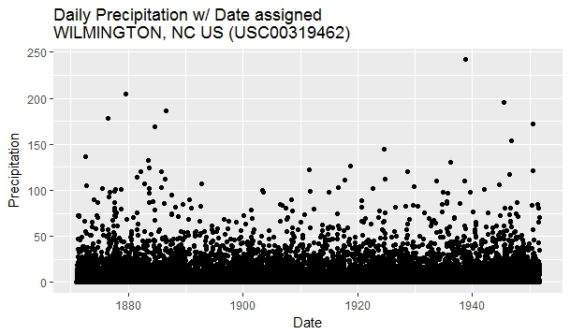
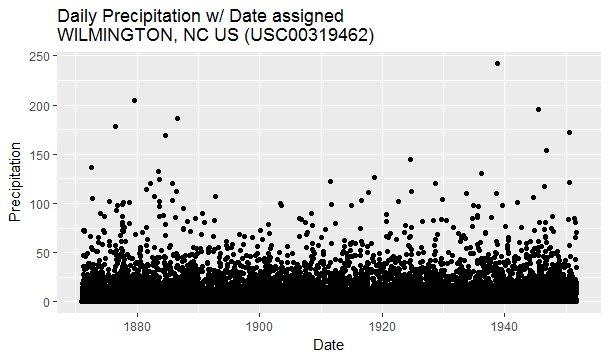
 Hurricane Florence was one of the most catastrophic hurricanes of the 2018 Atlantic hurricane season to have affected the Carolinas in September 2018. In addition to damage caused […]

by gmallya
Published October 4, 2018
Updated October 5, 2018
SPI spatial plot over India
D3 Data Science Research Tools

Standardized Precipitation Index over India


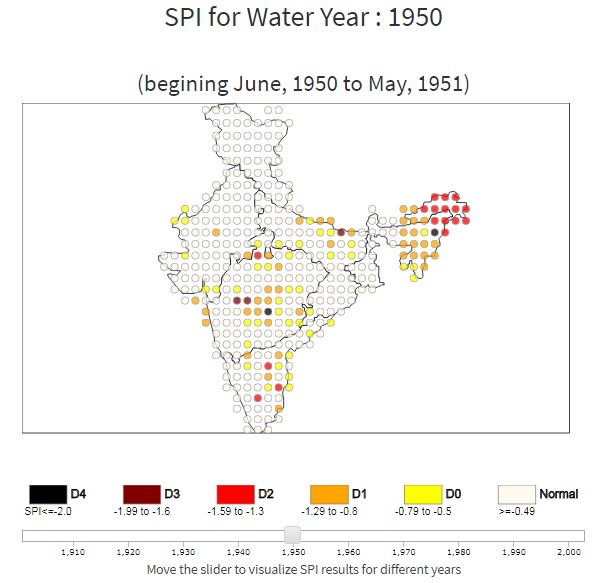
 An interactive plot displaying Standardized Precipitation Index (SPI) for 12-month time window ending in May has been made available on my Research Highlights page. The […]

  • CSS
  • D3
  • Data Science
  • data visualization
  • decision support tools
  • drought
  • drought index
  • drought viewer
  • HTML
  • India
  • JavaScript
  • SPI
  • Standardized precipitation index
  • Tools
by gmallya
Published April 18, 2018
Updated April 18, 2018
AnalyzeStockPrices
Data Science

Analyzing Stock Prices using Python


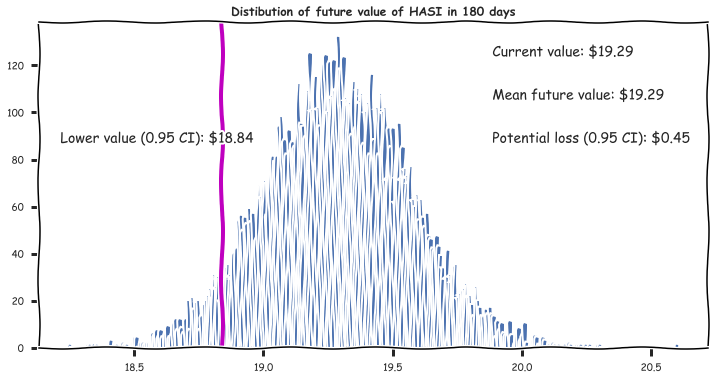
 The GIST (IPython Notebook) below shows you a hands-on step-by-step approach to analyze stock prices using Python. The notebook starts by first downloading historic prices […]

  • Data Science
  • Python
by gmallya
Published March 30, 2018
Updated March 30, 2018
AgreeDEM_error
Uncategorized

ArcHydro AgreeDEM Issues


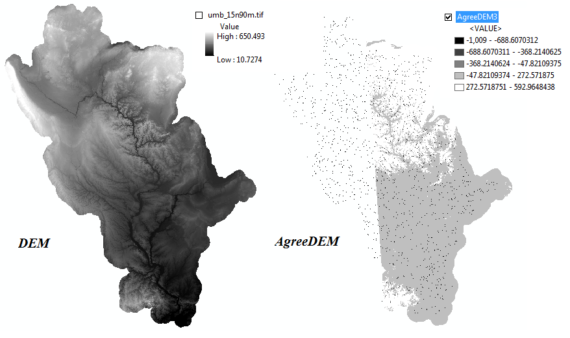
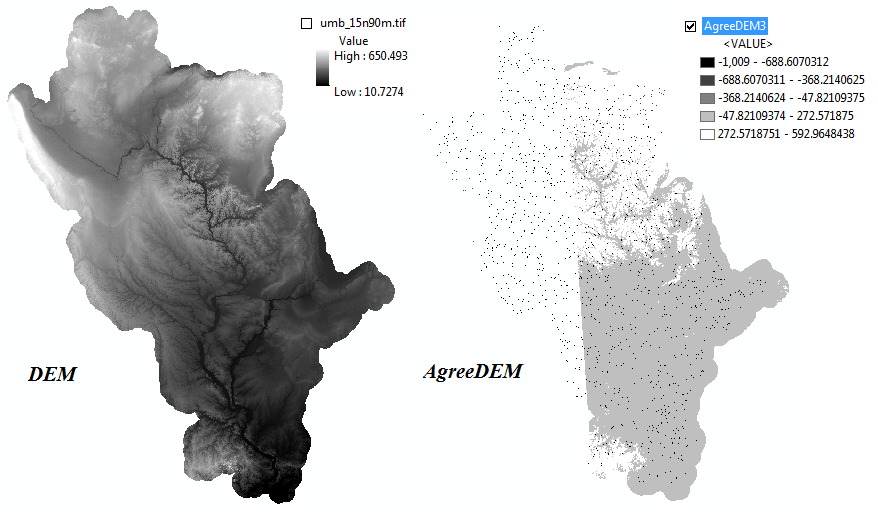
 ArcHydro AgreeDEM is empty or has pixels with no data. When delineating the watershed for the Upper Mississippi River Basin, I encountered a strange issue. […]

  • ArcGIS
  • ArcHydro
  • ESRI
  • GIS
  • Windows
by gmallya
Published February 14, 2018
Updated February 13, 2018

Posts navigation

    • 1
    • 2
  • Older posts Older posts

© 2025 Towards Open Science – All rights reserved

Designed with Customizr Pro