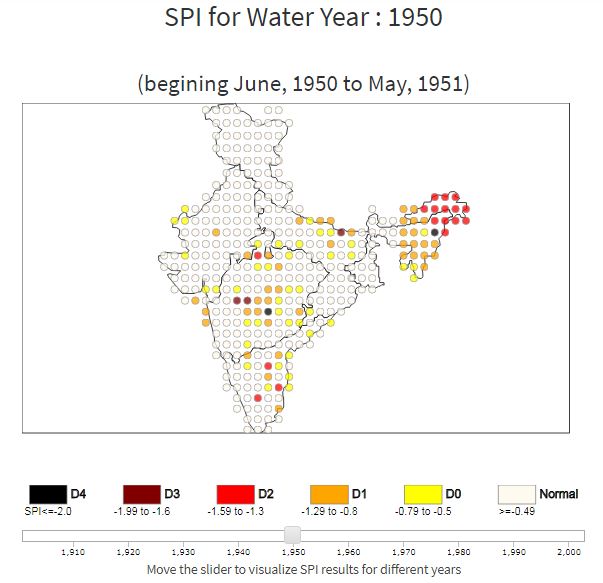
An interactive plot displaying Standardized Precipitation Index (SPI) for 12-month time window ending in May has been made available on my Research Highlights page. The 12-month time window beginning in June and ending in May of the following year was chosen to represent water year over India. The precipitation data set used in this analysis was obtained from India Meteorological Department, and is available at 1 degree by 1 degree grids. The analysis period is from 1901 to 2003.
You may also like
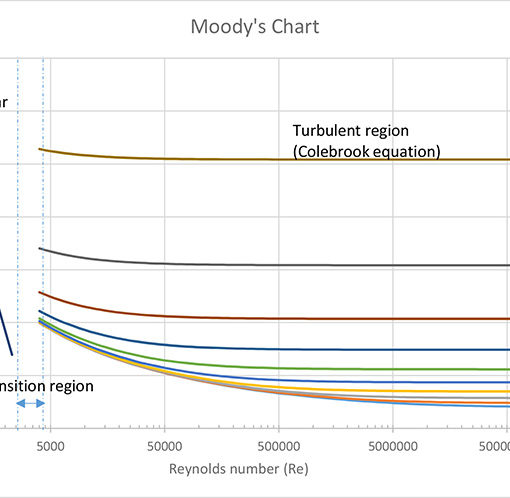
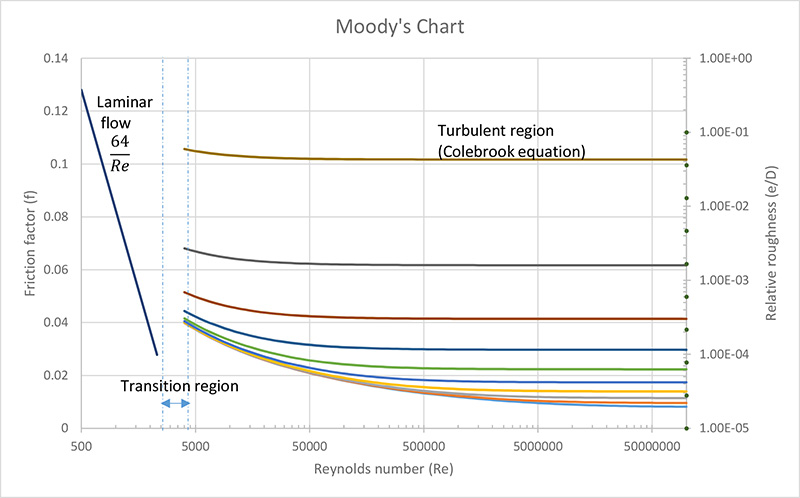
Friction factor is used when calculating head loss due to friction (i.e. Darcy’s equation) in pressurized pipes or ducts. Moody’s Friction Factor […]
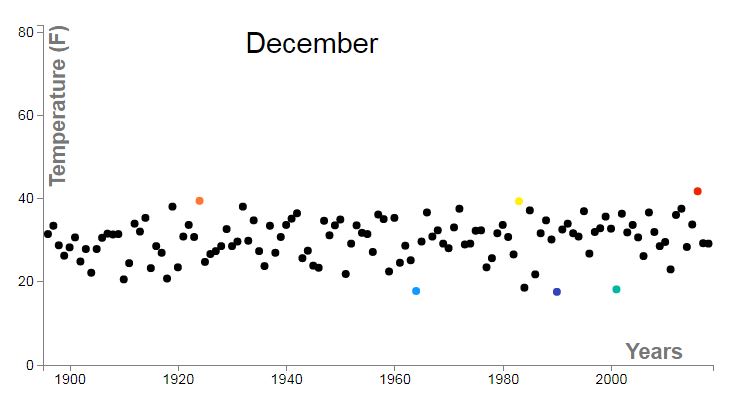
In the previous post, we looked at daily temperatures during November 2018 at the ACRE weather station in West Lafayette, IN. We […]
I was working on a water quality project over the past few days, and the results I obtained were quite interesting. One […]
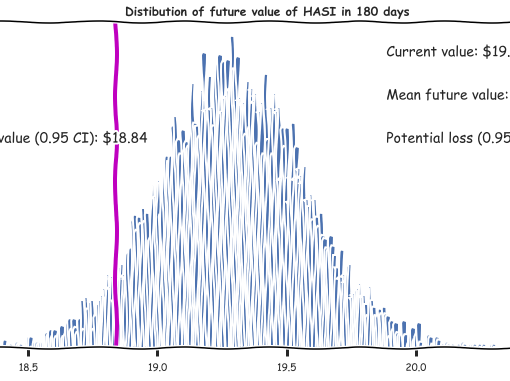
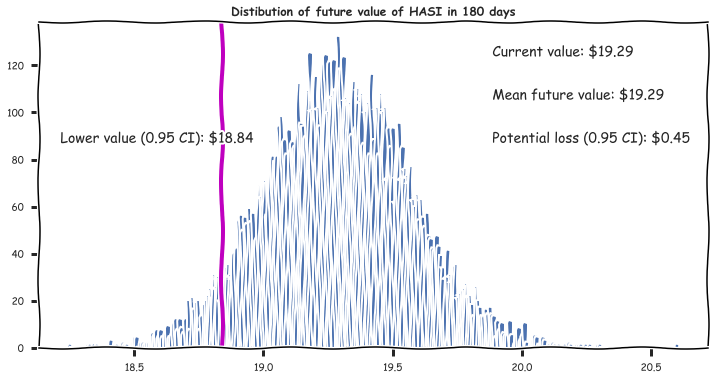
The GIST (IPython Notebook) below shows you a hands-on step-by-step approach to analyze stock prices using Python. The notebook starts by first […]