In this blog post, interactive and static visualizations of weather data during the last 10 years over West Lafayette, IN, the home of Purdue University is presented.
The data is obtained from Midwest Regional Climate Center (MRCC) for the following station located in West Lafayette – WEST LAFAYETTE 6 NW. Station details are provided at the end of the post. Daily data available during the period June 01, 2010 to May 31, 2020 are visualized below for the following variables: maximum temperature in degree Celcius, precipitation in millimeters (mm), and type of weather-day [sunny (or no precipitation), rain, snow, and drizzle]. Missing data records were imputed. Type of weather day was decided based on rainfall amount and snow accumulation information available at the station and is slightly subjective.
Interative Visualization – Exploring Relationship between Temperature, Precipitation, and Weather-Days – Daily data binned over different Months
Three plotting panels shown below are connected to one another and allows the user to interact with the data. Users can click and drag the mouse pointer in the first and third panels to make a selection. In the second or the center panel, users can click on the bars to isolate data for a particular weather day. To unselect – click anywhere in the panel, but outside the selection.
Inspiration from @jakevdp’s work
Typical Weather-Days during a Month
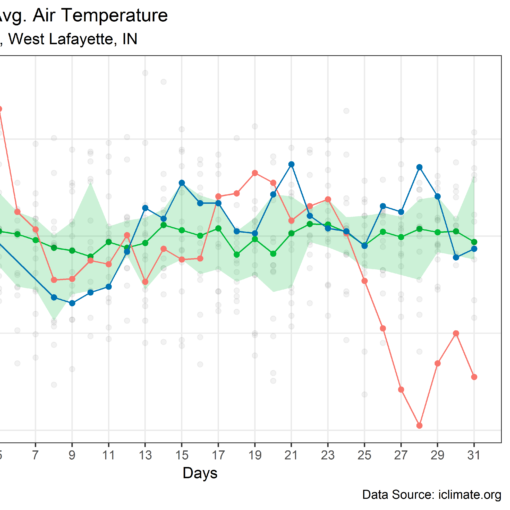
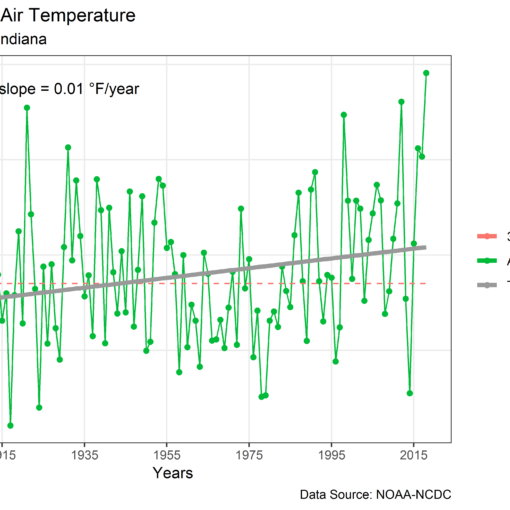
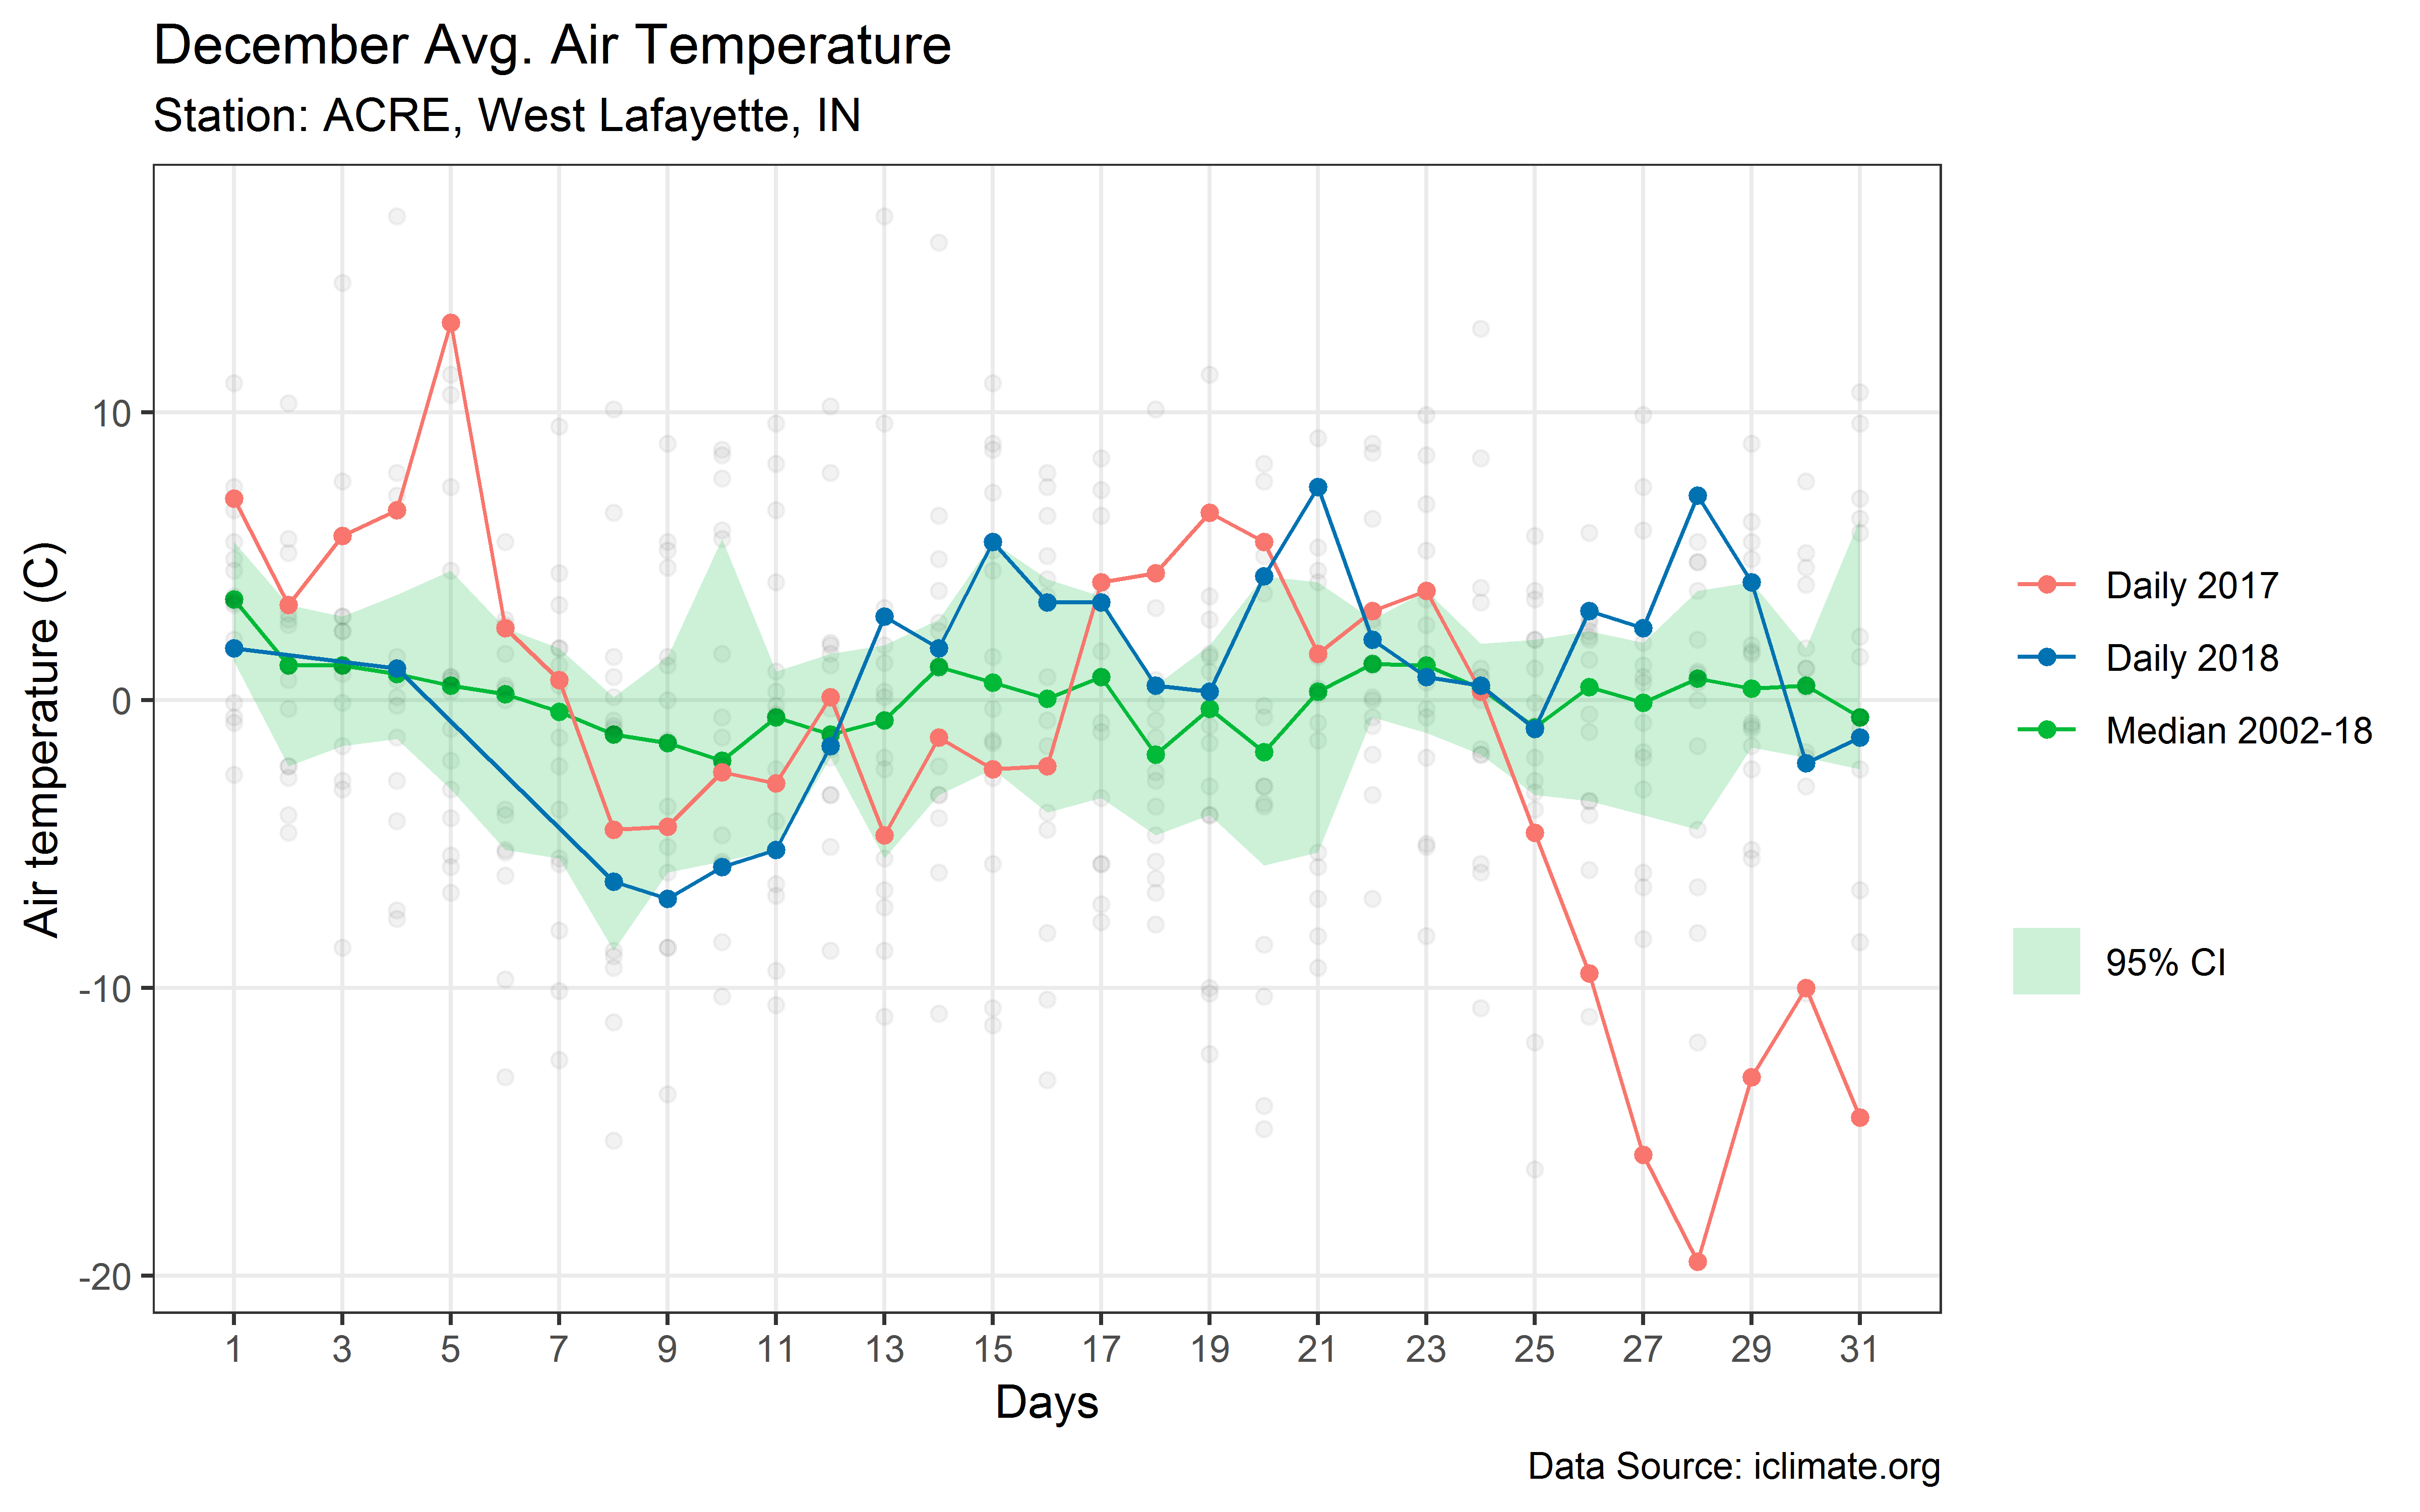
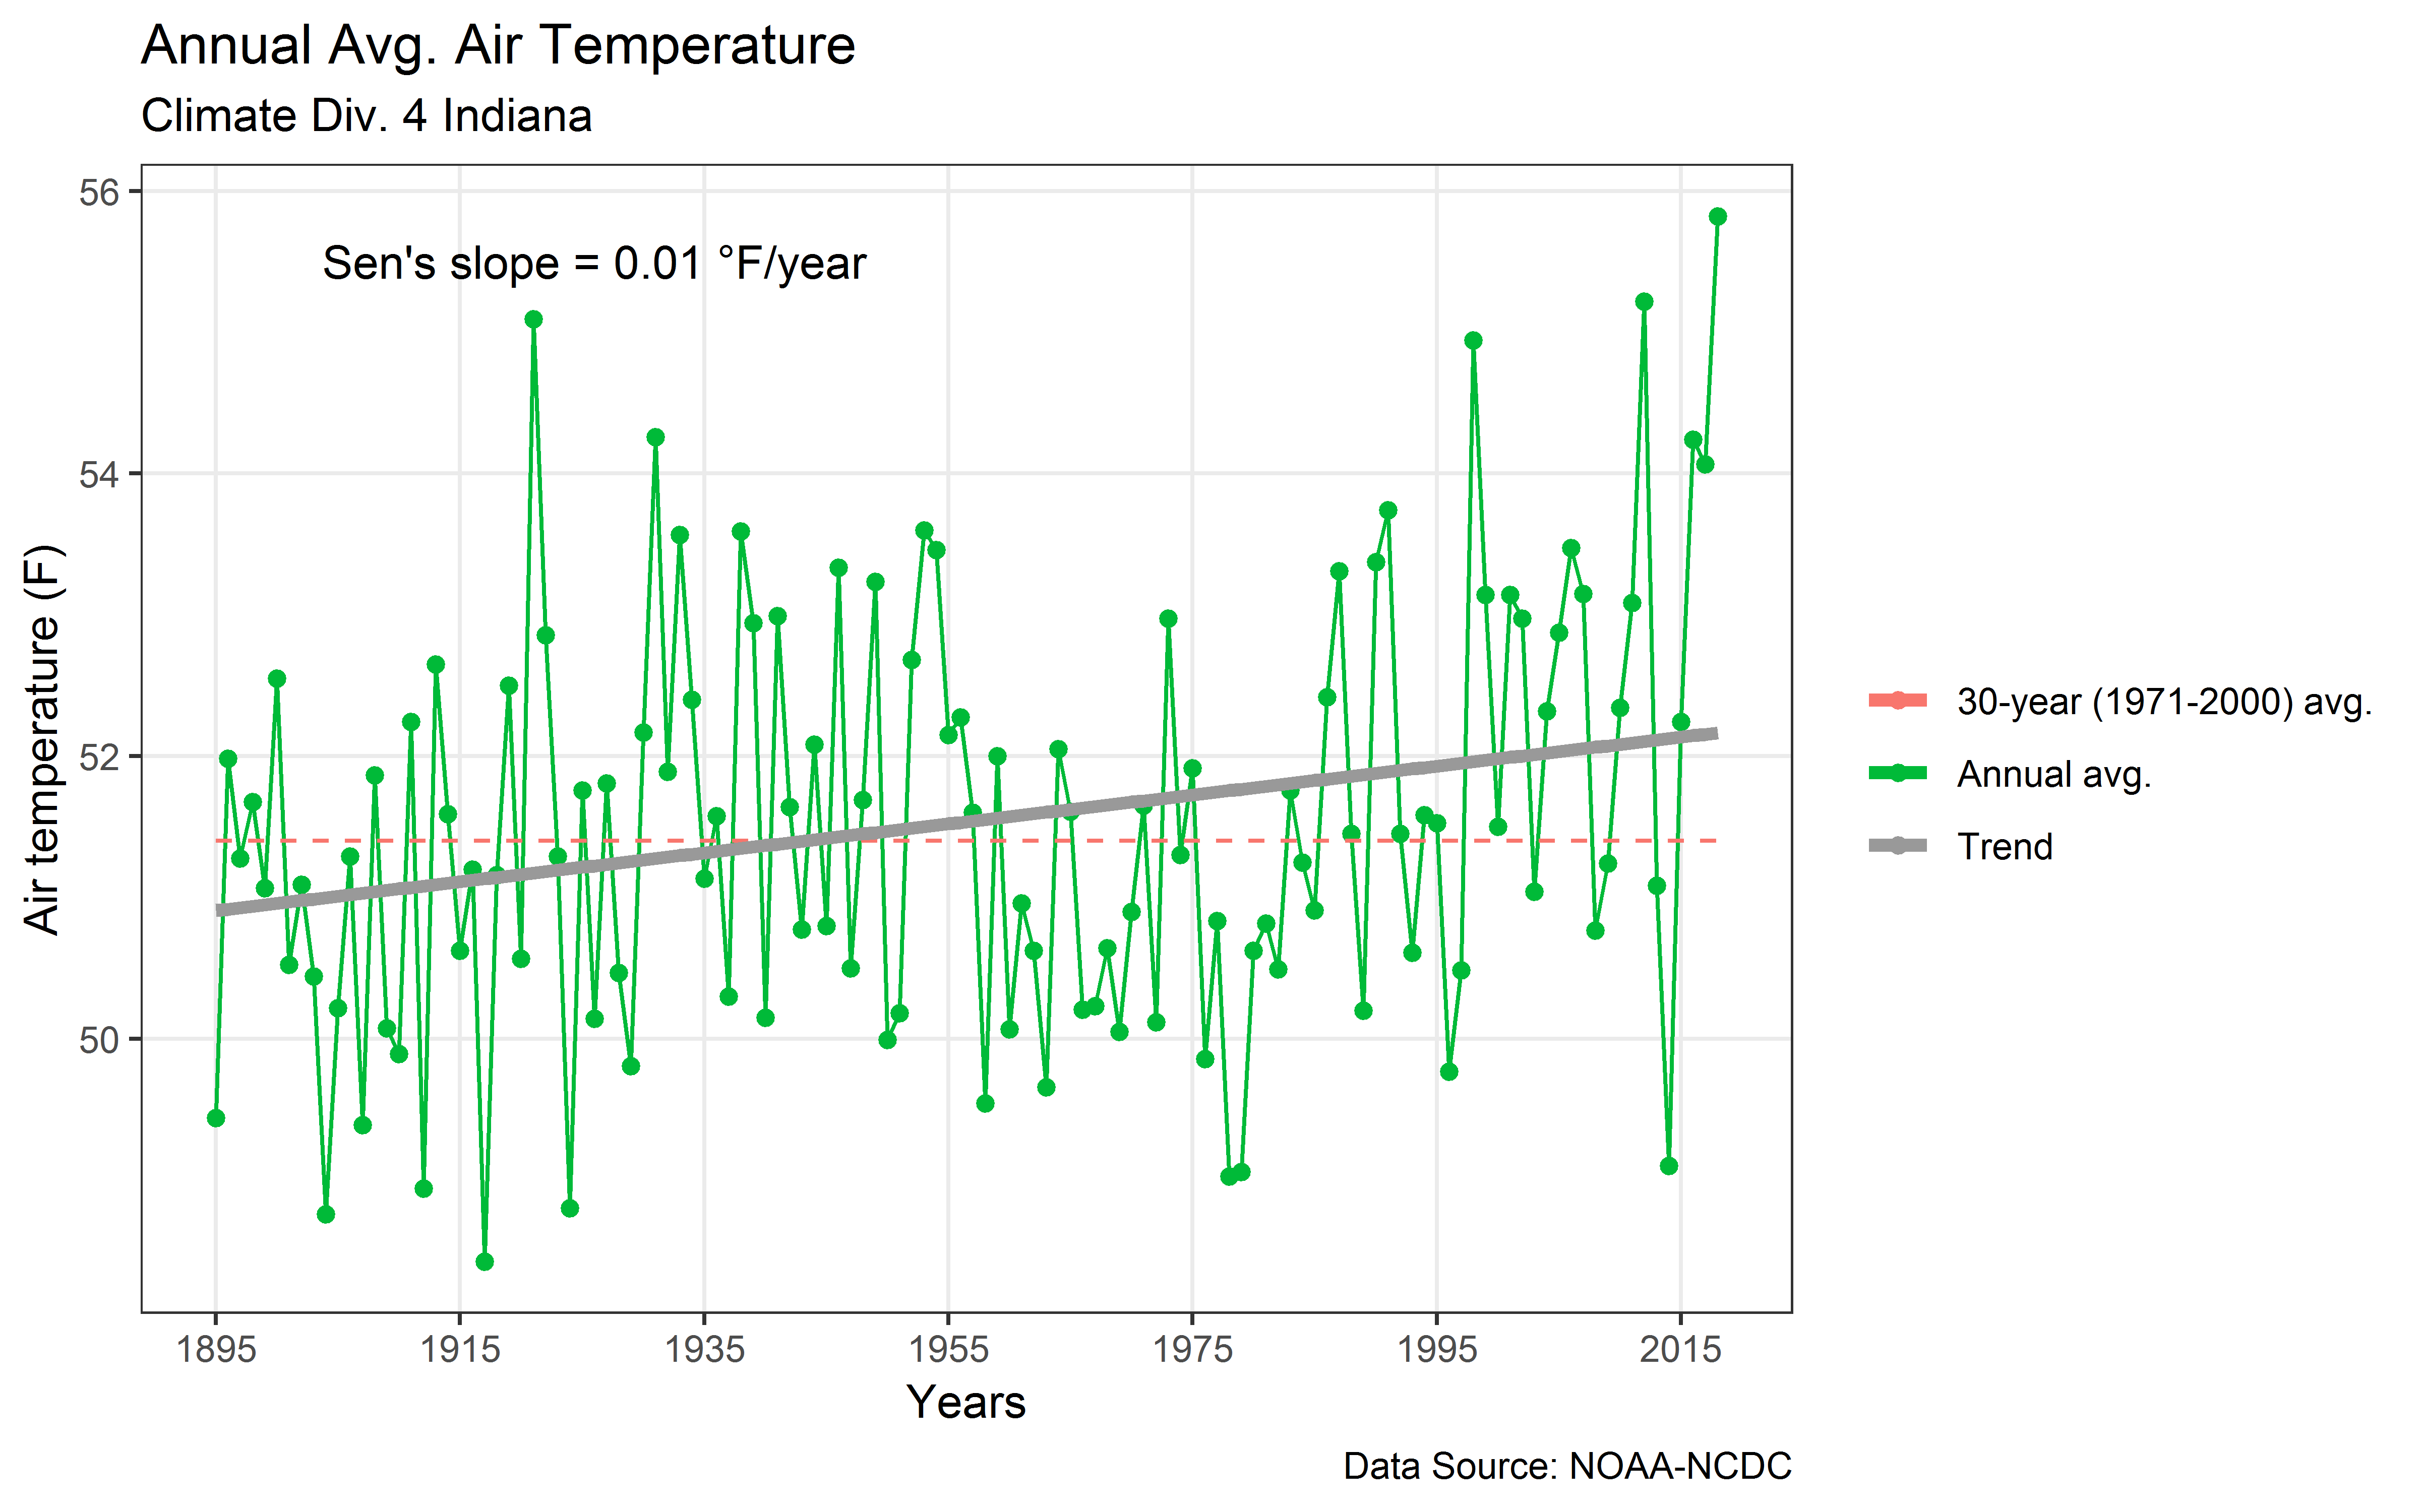
Variation of Maximum Temperature over last 10 years at Purdue University
Variation of Minimum Temperature over last 10 years at Purdue University
Monthly Mean Precipitation
Histogram of Precipitation
Station details
Station Name: WEST LAFAYETTE 6 NW
County: TIPPECANOE
State: IN
Climate Division: 04
Lat/Lon: 40.475 / -86.9919
Elevation (ft): 708
NWS Coop Number: 129430
GHCN ID: USC00129430
NWSLI: LFYI3 and WLFI3
Data source: MRCC