1. Hidden Markov model-based probabilistic assessment of droughts [preprint]
Droughts are characterized by drought indices that measure the departure of meteorological and hydrological variables, such as precipitation and streamflow, from their long-term averages. While many drought indices have been proposed in the literature, most of them use pre-defined thresholds for identifying drought classes ignoring the inherent uncertainties in characterizing droughts. This study employed a hidden Markov model (HMM) for probabilistic classification of drought states. Apart from explicitly accounting for the time dependence in the drought states, the HMM-based drought index (HMM-DI) provides model uncertainty in drought classification. The proposed HMM-DI was used to assess drought characteristics in Indiana using monthly precipitation and streamflow data. The HMM-DI results were compared to those from standard indices and the differences in classification results from the two models were examined.
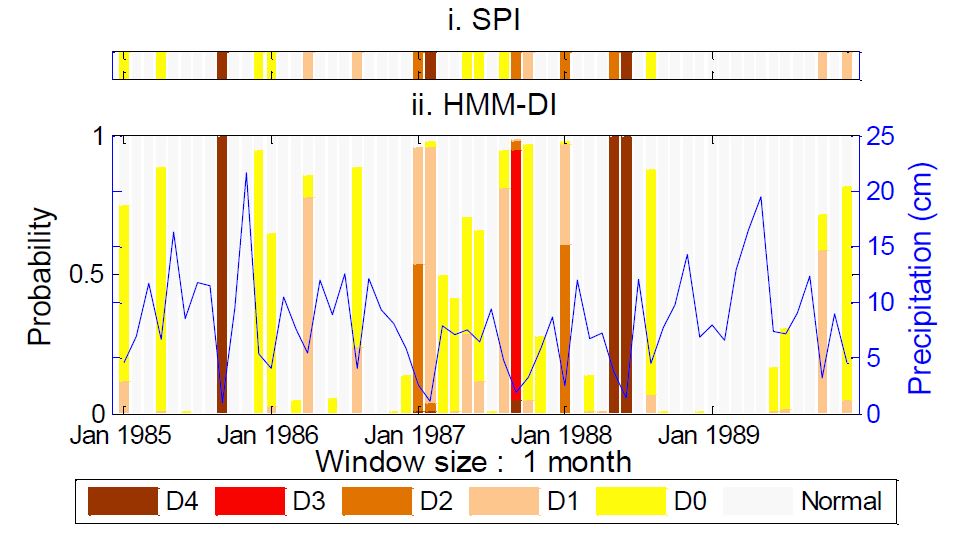
The figure above compares HMM-DI and SPI drought classification for a 1-month window at Alpine 2 NE station for a 5-year block 1985-89. The line plot corresponds to the cumulative precipitation total at the location used for computing the results based on the window size.
Since drought indices are designed with a specific purpose depending on local and regional needs, there is no one true index. Rather than pre-defined thresholds, the HMM-DI allows the data to determine classification boundaries, and provides new insights into drought features. Comparisons with classifications from Standardized Precipitation Index (SPI) or Standardized Streamflow Index (SSI) were only for revealing differences in results between the models.
The current study evaluated data at individual locations or aggregated data over climatic divisions. The graphical nature of this index could be exploited to provide a principled approach for searching physical mechanisms that trigger droughts. Given the generative nature of HMM-DI, it can be used for short-term drought forecasting, computation of future water deficits, and for estimating the probability of recovering from existing droughts.
2. 2012 Midwest Droughts in the United States [preprint]
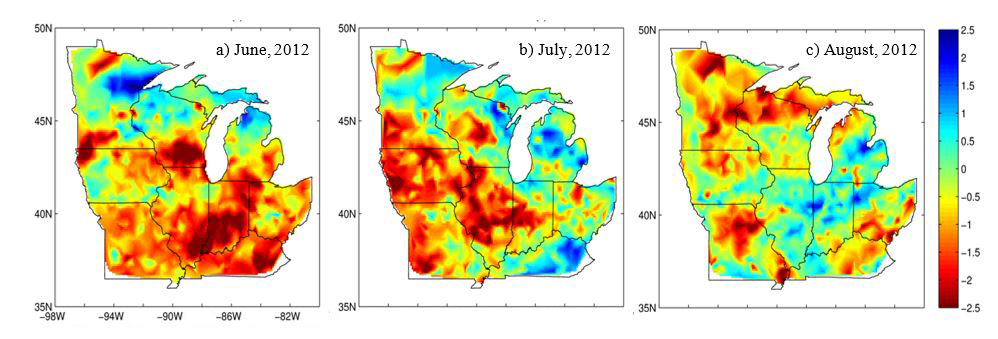
The 2012 North American Drought was one of the costliest and the most widespread natural disasters in United States history. While several states across the US were experiencing drought conditions to varying degrees of severity, the Midwest and Northern Plains were perhaps the most affected. The drought severely impacted agricultural activities across the US, particularly corn and soybean crops, prompting federal agencies including U.S. Department of Agriculture to declare disaster areas and to provide assistance to those affected by this calamity. The focus of this work was to utilize existing and new techniques to provide insights into the severity of the 2012 Midwest drought and its impacts over the region.
3. Probabilistic assessment of droughts over Indian monsoon region using Gamma Mixture Model [preprint]
In an earlier study we used hidden Markov models (HMM) for quantifying uncertainties in drought classification. The HMM method conceptualises drought classes as distinct hydrological states that are not observed (hidden) but affect observed hydrological variables. The number of drought classes or hidden states in the model is pre-specified, which can sometimes result in model over-specification problem. This study proposes an alternate method for probabilistic drought classification where the number of states in the model is determined by the data. The proposed method adapts standard precipitation index (SPI) methodology of drought classification by employing gamma mixture model (Gamma-MM) in a Bayesian framework. The method alleviates the problem of choosing a suitable distribution for fitting data in SPI analysis, quantifies modeling uncertainties, and propagates them for probabilistic drought classification. The method is tested on rainfall data over India. Comparison of the results with standard SPI show important differences particularly when SPI assumptions on data distribution are violated. Further, the new method is simpler and more parsimonious than HMM based drought classification method and can be a viable alternative for probabilistic drought classification.
Check the interactive plot below!
SPI for Water Year : 1950
(begining June, 1950 to May, 1951)
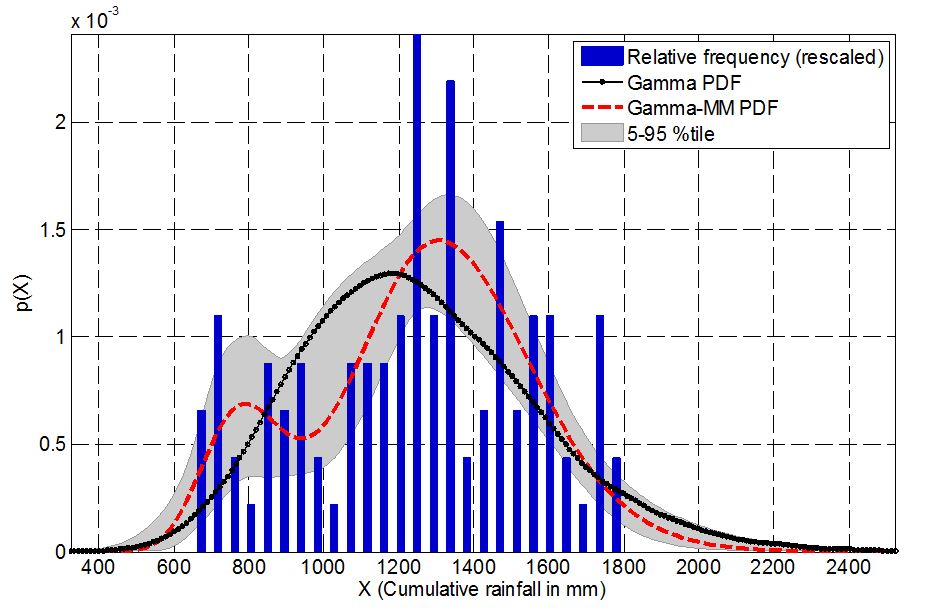
The figure above compares the relative frequency of the cumulative rainfall amounts in a water-year at Grid 125 located in Chhattisgarh, India, and probability density functions of the fitted gamma distribution (Gamma PDF) and gamma mixture model (Gamma-MM PDF). The grey band shows 90% credible interval (5th and 95th percentile) of the Gamma-MM PDF.
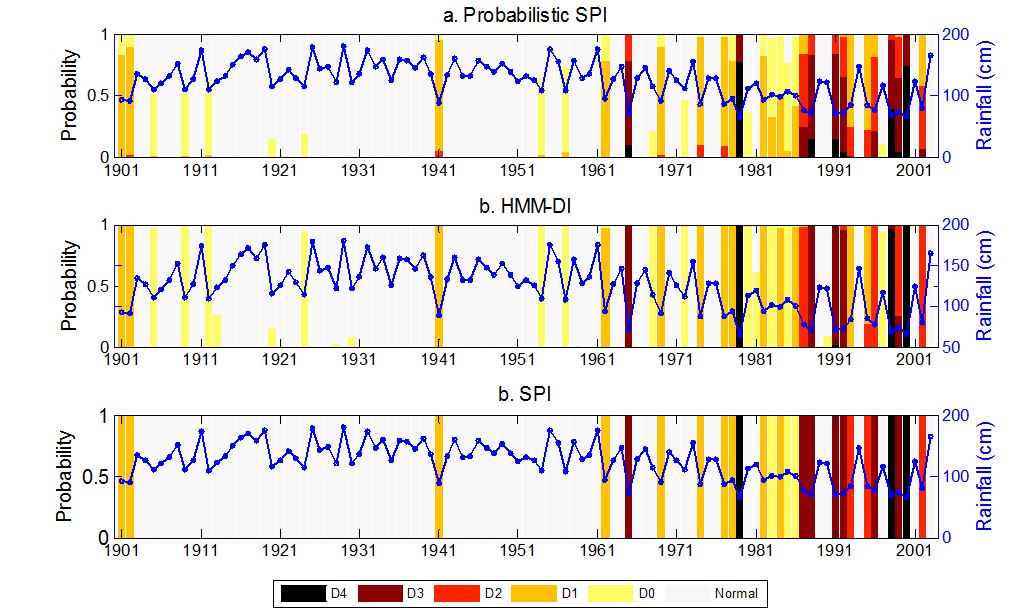
The figure above compares the classification of historical droughts during a water-year at Grid 125 (Chhattisgarh, India) using probabilistic SPI (based on GammaMM), HMM-DI, and standard SPI approaches. The solid blue line represents cumulative rainfall during a water-year, a colored bar denotes drought classes and its length represents probability of drought state.
4. Trends and Variability of Drought Occurances over Indian Monsoon Region over the last Century. [Full paper]
Recent studies have highlighted that the Indian Monsoon Region (IMR) has a steady increase in the drought patterns. Motivated by the cautionary conclusions of Trenberth et al. (2014), a reassessment of the drought patterns using multiple data sources and methods was desired. Accordingly, we examined the long-term retrospective drought characteristics for the Indian monsoon region using two different precipitation datasets (i.e., India Meteorological Department and University of Delaware) and standard precipitation index (SPI), standardized precipitation-evapotranspiration index (SPEI), Gaussian mixture model-based drought index (GMM-DI), and hidden Markov model-based drought index (HMM-DI) for the period 1901–2004. Drought trends and variability were analyzed for three epochs: 1901–1935, 1936–1971 and 1972–2004. Irrespective of the dataset and methodology used, the results indicate an increasing trend in drought severity and frequency during the recent decades (1972–2004). The study also found that the droughts are becoming more regional and are showing a general shift to the agriculturally important coastal south-India, central Maharashtra, and Indo-Gangetic plains indicating higher food security and socioeconomic vulnerability in the region.
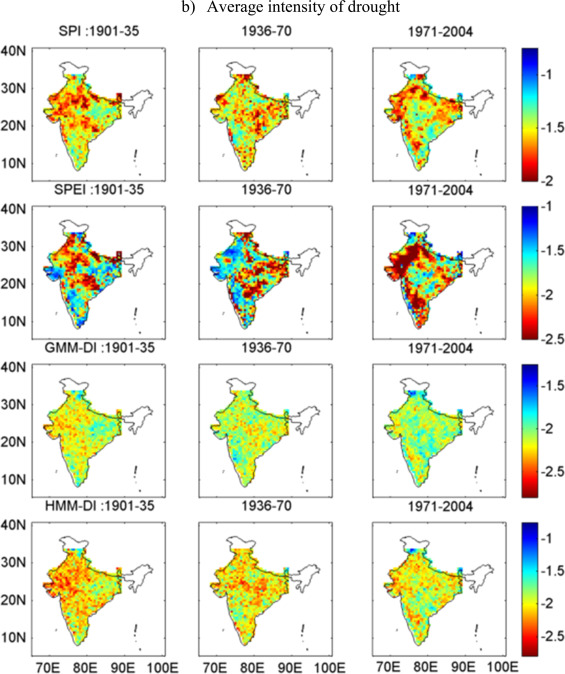
The figure above compares Epochal variation in average intensity of drought over the Indian Monsoon Region using 0.5 degree University of Delaware precipitation dataset. The top panel represents SPI, followed by SPEI, GMM-DI, and HMM-DI.
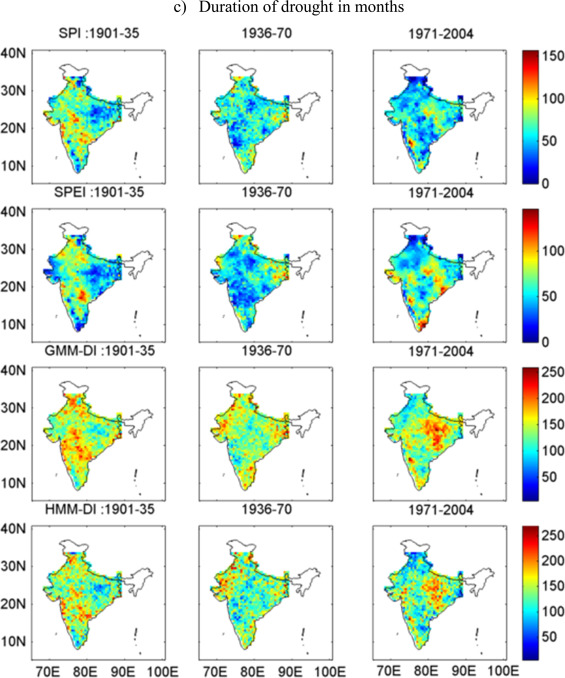
The figure above shows the Epochal variation in average duration of drought over the Indian Monsoon Region using 0.5 degree University of Delaware precipitation dataset. The top panel represents SPI, followed by SPEI, GMM-DI, and HMM-DI.
5. Composite measures of watershed health from a water quality perspective [preprint]
Water quality data at gaging stations are typically compared with established federal, state, or local water quality standards to determine if violations (concentrations of specific constituents falling outside acceptable limits) have occurred. Based on the frequency and severity of water quality violations, risk metrics such as reliability, resilience, and vulnerability (R-R-V) are computed for assessing water quality-based watershed health. In this study, a modified methodology for computing R-R-V measures is presented, and a new composite watershed health index is proposed. Risk-based assessments for different water quality parameters (Suspended Sediments, Nitrogen, and Phosphorus) are carried out using identified national sampling stations within the Upper Mississippi River Basin, the Maumee River Basin, and the Ohio River Basin.
The study also reports the distributional properties of risk measures with respect to water quality parameters. Scaling behaviors of risk measures using stream order, specifically for the watershed health (WH) index, suggest that WH values increased with stream order for suspended sediment concentration, nitrogen, and orthophosphate in the Upper Mississippi River Basin.
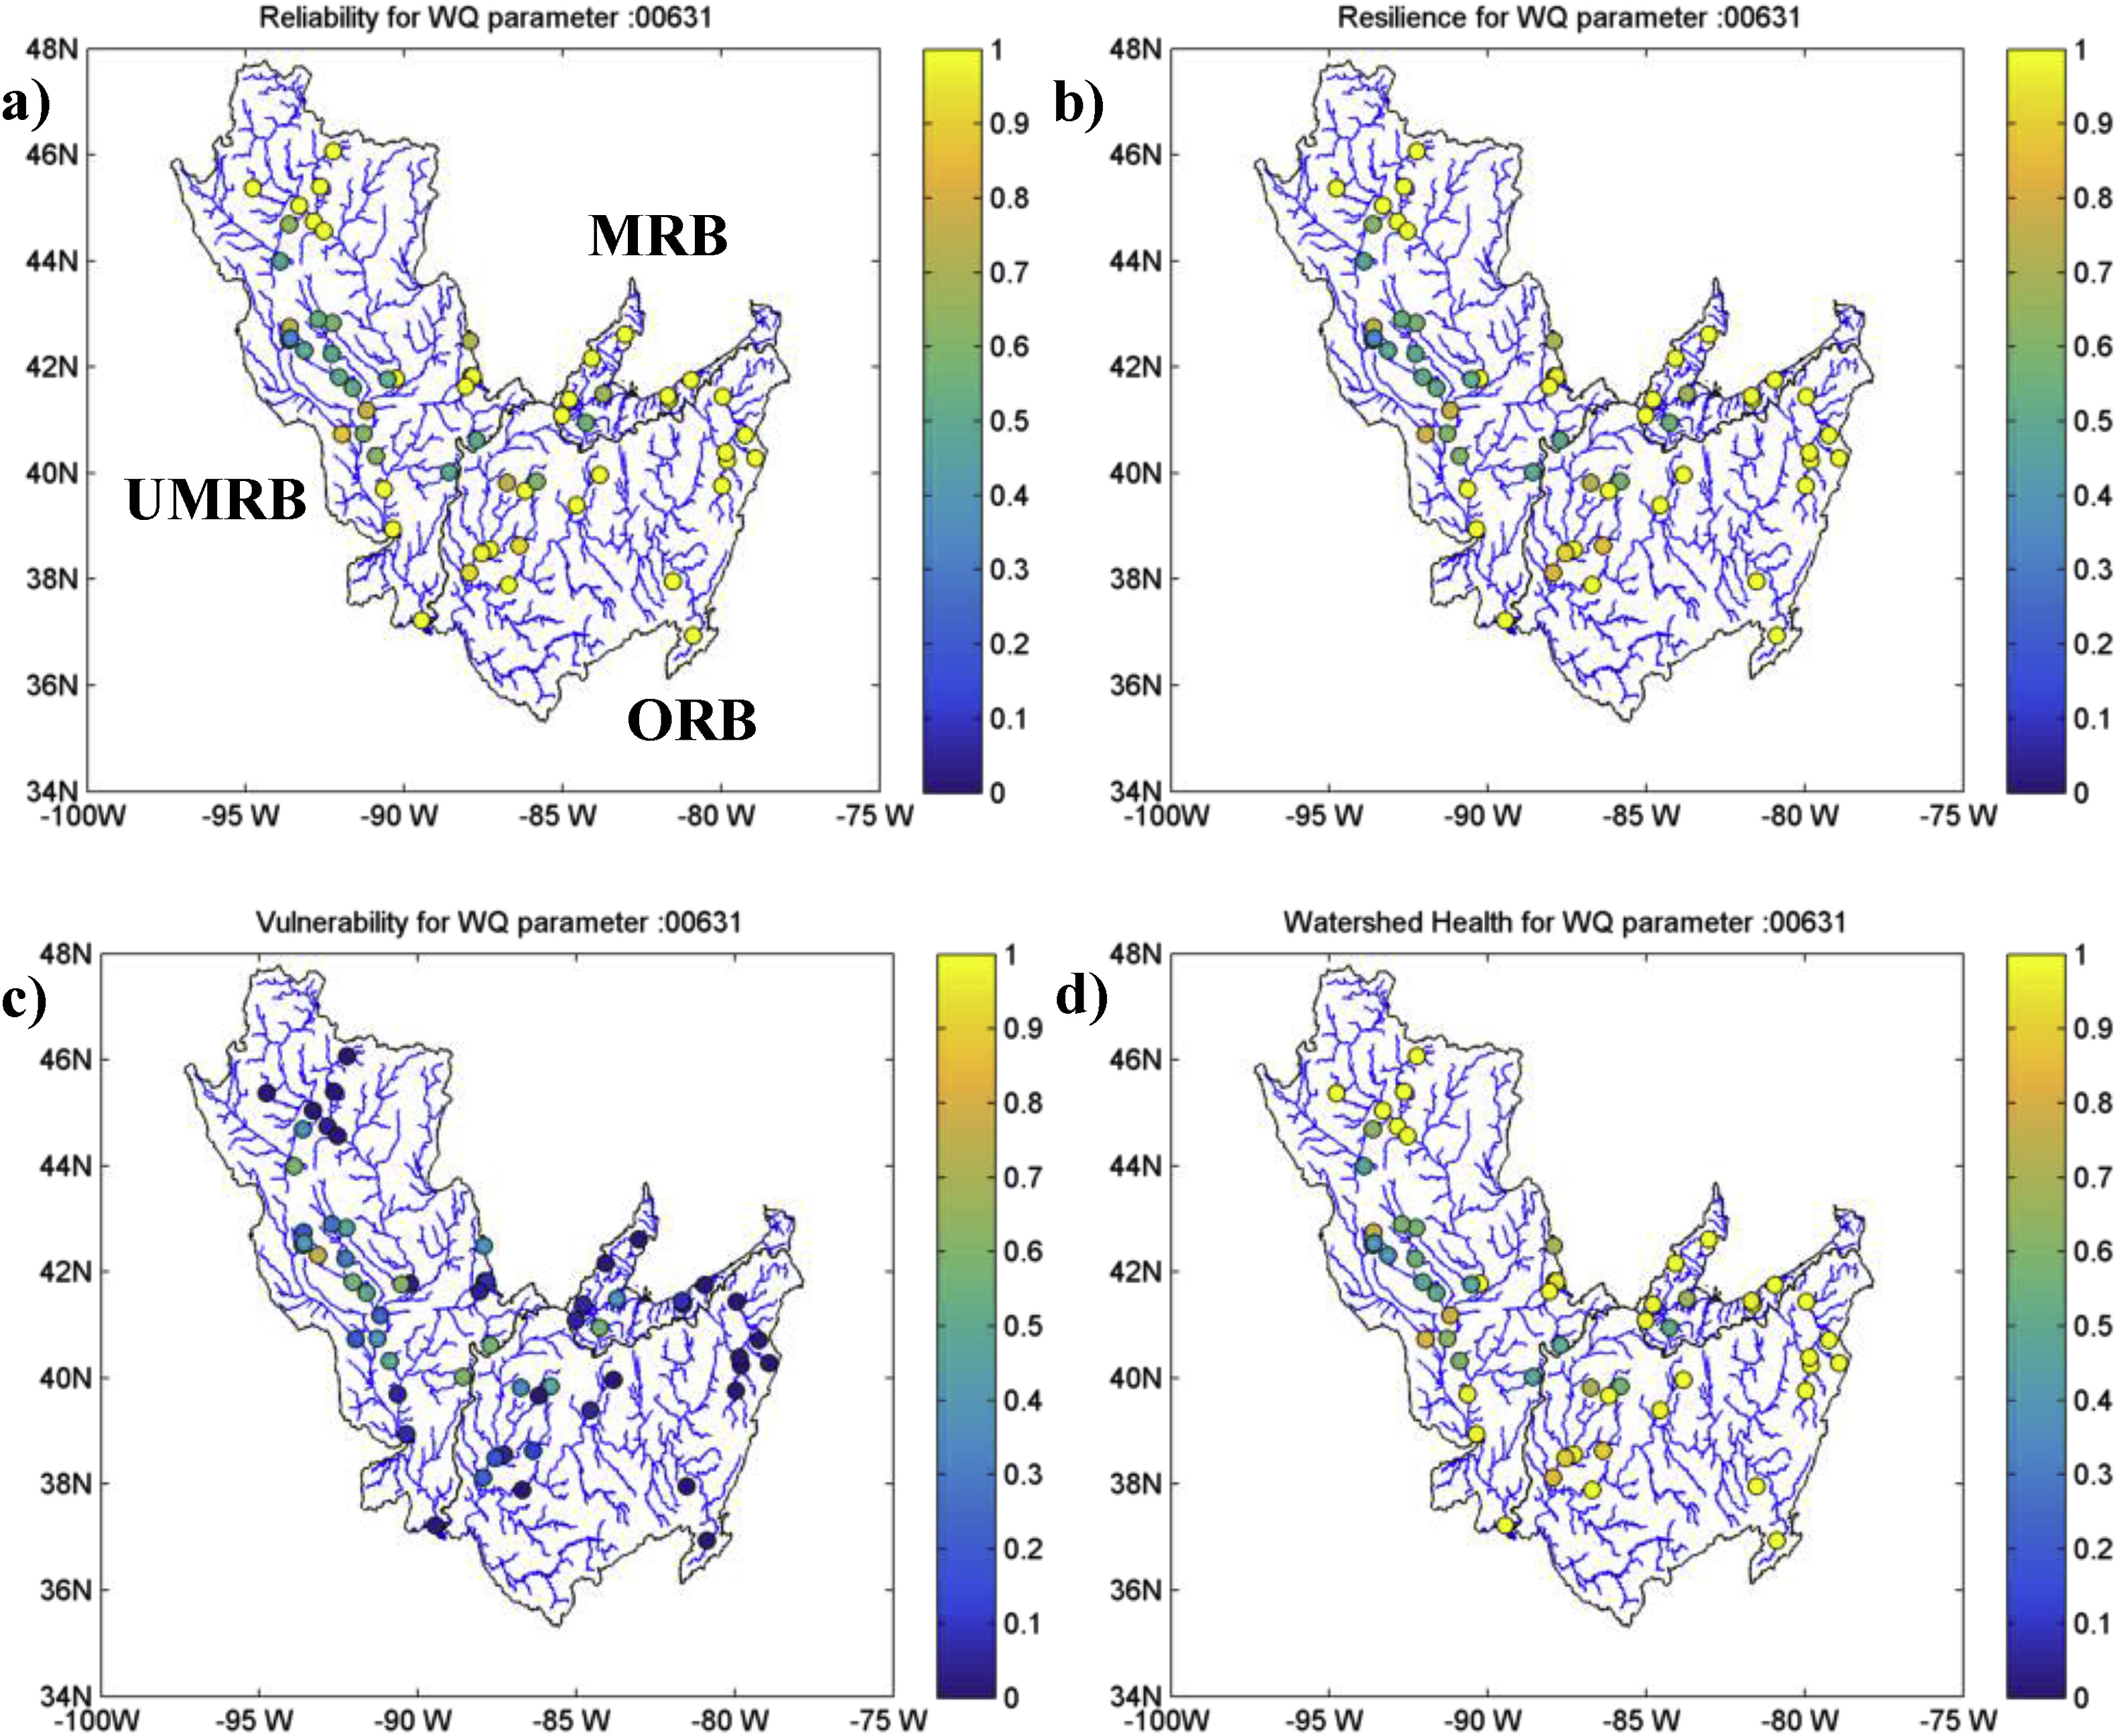
Spatial distribution of risk measures enable identification of locations exhibiting poor watershed health with respect to the chosen numerical standard, and the role of land use characteristics within the watershed. The figure above shows the spatial distribution of risk metrics for Nitrogen (parameter code: 00631) which can be used to visually identify locations with low watershed health values. Several stations in the upper reaches of UMRB and ORB, and few stations in MRB have high reliability values (equal to 1.0) for nitrogen indicating zero violations with respect to the chosen standard. These stations drain areas with predominant forest land use. Stations with agriculturally intensive drainage areas have lower reliability, resilience and watershed health, and higher values of vulnerability.
Overall, the study found that the watershed health with respect to different water quality parameters were most impacted in agriculturally dominated watersheds, while those with highest percentage of forested areas (and thus most protected from changes) were not. The watershed health values at these relatively undisturbed (pristine) forested watersheds give us an estimate of what to expect as the upper limit of good watershed health.
6. Uncertainty Quantification in Reconstruction of Sparse Water Quality Time Series: Implications for Watershed Health and Risk-Based TMDL Assessment [preprint] [TMDL DST Tool] [Water quality reconstruction tool – Google Maps interface]
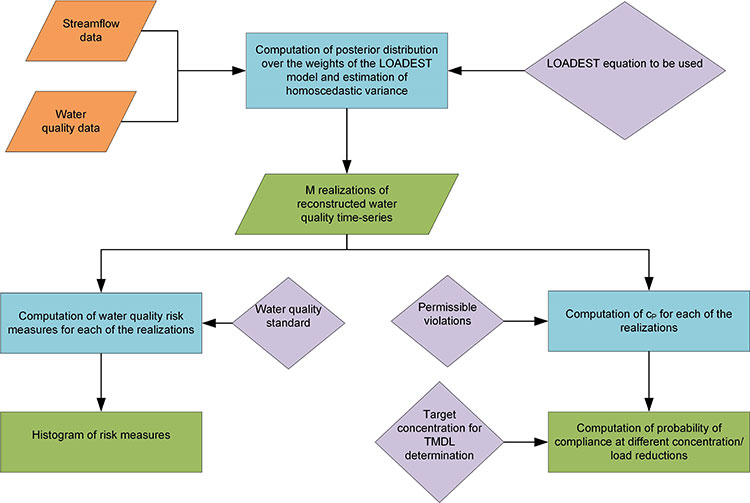
Despite the plethora of methods available for uncertainty quantification, their use has been limited in the practice of water quality (WQ) modeling. In this paper, a decision support tool (DST) that yields a continuous time series of WQ loads from sparse data using streamflows as predictor variables is presented. The DST estimates uncertainty due to residual errors using a relevance vector machine. To highlight the importance of uncertainty quantification, two applications enabled within the DST are discussed. The DST computes (i) probability distributions of four measures of WQ risk analysis- reliability, resilience, vulnerability, and watershed health- as opposed to single deterministic values and (ii) concentration/load reduction required in a WQ constituent to meet total maximum daily load (TMDL) targets along with the associated risk of failure. Accounting for uncertainty reveals that a deterministic analysis may mislead about the WQ risk and the level of compliance attained with established TMDLs.
The DST provides a probabilistic estimate of watershed health and the required reduction in pollutant concentration/load as a function of the risk of violating TMDL criteria. The figure below shows the overview of the three tasks carried out by the DST. The study used St. Joseph River Watershed (spread over parts of Indiana, Michigan, and Ohio) as a test case, and the importance of uncertainty in assessing watershed health and TMDL was illustrated. While other investigators (e.g., Borsuk et al., 2002; Hantush and Chaudhary, 2014, and others) have demonstrated the benefits of probabilistic uncertainty estimation in TMDLs, no study has implemented such a framework at the watershed scale, to the best of our knowledge.
The DST tool allows users to reconstruct (or estimate) water quality concentration (or load) values using streamflow values as predictor variables and employing the state-of-the-art relevance vector machine (RVM; Tipping, 2001) that can accommodate nonlinear transformations between streamflow and sparse water quality observations.
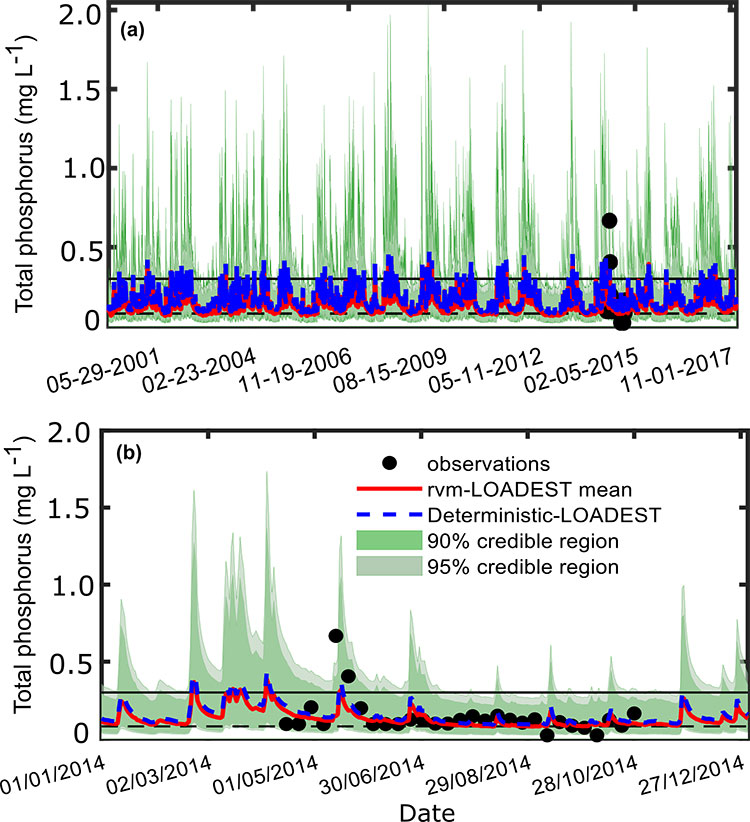
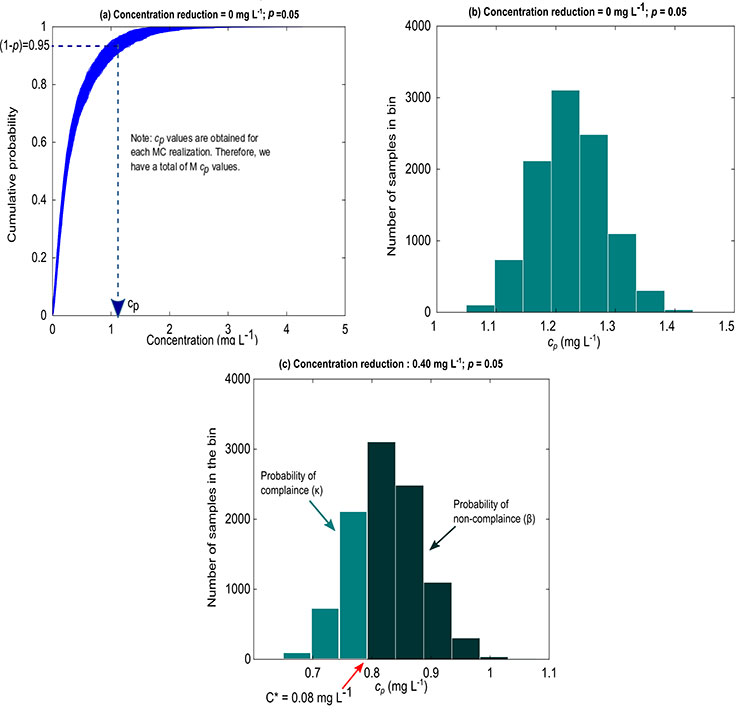
The DST tool also calculates the probability of compliance for different cases of load or concentration reduction. This process is graphically illustrated in the figure below. First we start with 10000 simulations of reconstructed water quality time-series (see panel (a) in the figure below). Then for each simulated water quality time-series we assume that top p% of the values are permissible violations (i.e. rare events are ignored, p is typically between 1% to 10%, depending on the type of water quality constituent). Note down the concentration corresponding to (100-p)%. Using these 10,000 concentration (Cp) values we can determine what fraction of the values lie below acceptable TMDL threshold (C*). This fraction is termed as the probability of compliance given our model uncertainty (see panel (c) in the figure below).