Over the Thanksgiving weekend, there was a lot of buzz about global warming and climate change on Twitter thanks to politicians, media, and the public. Just because November 2018 Air Temperatures have been low over most parts of the USA compared to the past, many have started labeling anthropogenic global warming as #FakeNews. I want to remind readers that these conversations (not) surprisingly coincided with the release of federally-mandated climate change study that was released on Friday (November 23, 2018) after Thanksgiving.
Over the past few years, my work has focussed on hydro-climatology. Having read hundreds of peer-reviewed papers over the years, and also supported by my research, I know that anthropogenic climate change and global warming are real and require immediate attention. The latest climate change report highlighted the devastating effects climate change would have on the USA by the end of the century. The potential loss due to climate change was reported in terms of the GDP. However, it is essential to acknowledge that the effects of climate change on human life can be far worse and also hard to objectively quantify. Also, the climate change effects are felt all over the globe, and therefore one has to consider the impact at the global scale.
Sitting at my desk over the Thanksgiving break and responding to some review comments on a manuscript, I thought why not play with some local temperature data and see if indeed air temperature in my town was at/near record low. After all, the weather has been cloudy over the break, and I haven’t stepped out without wearing a jacket for more than three weeks. Plus, we have had several light snow showers beginning as early as late October. So I understand why people (not politicians) may have doubts over global warming. So just for fun, I have plotted November 2018 air temperature data and compared it to the long-term mean.
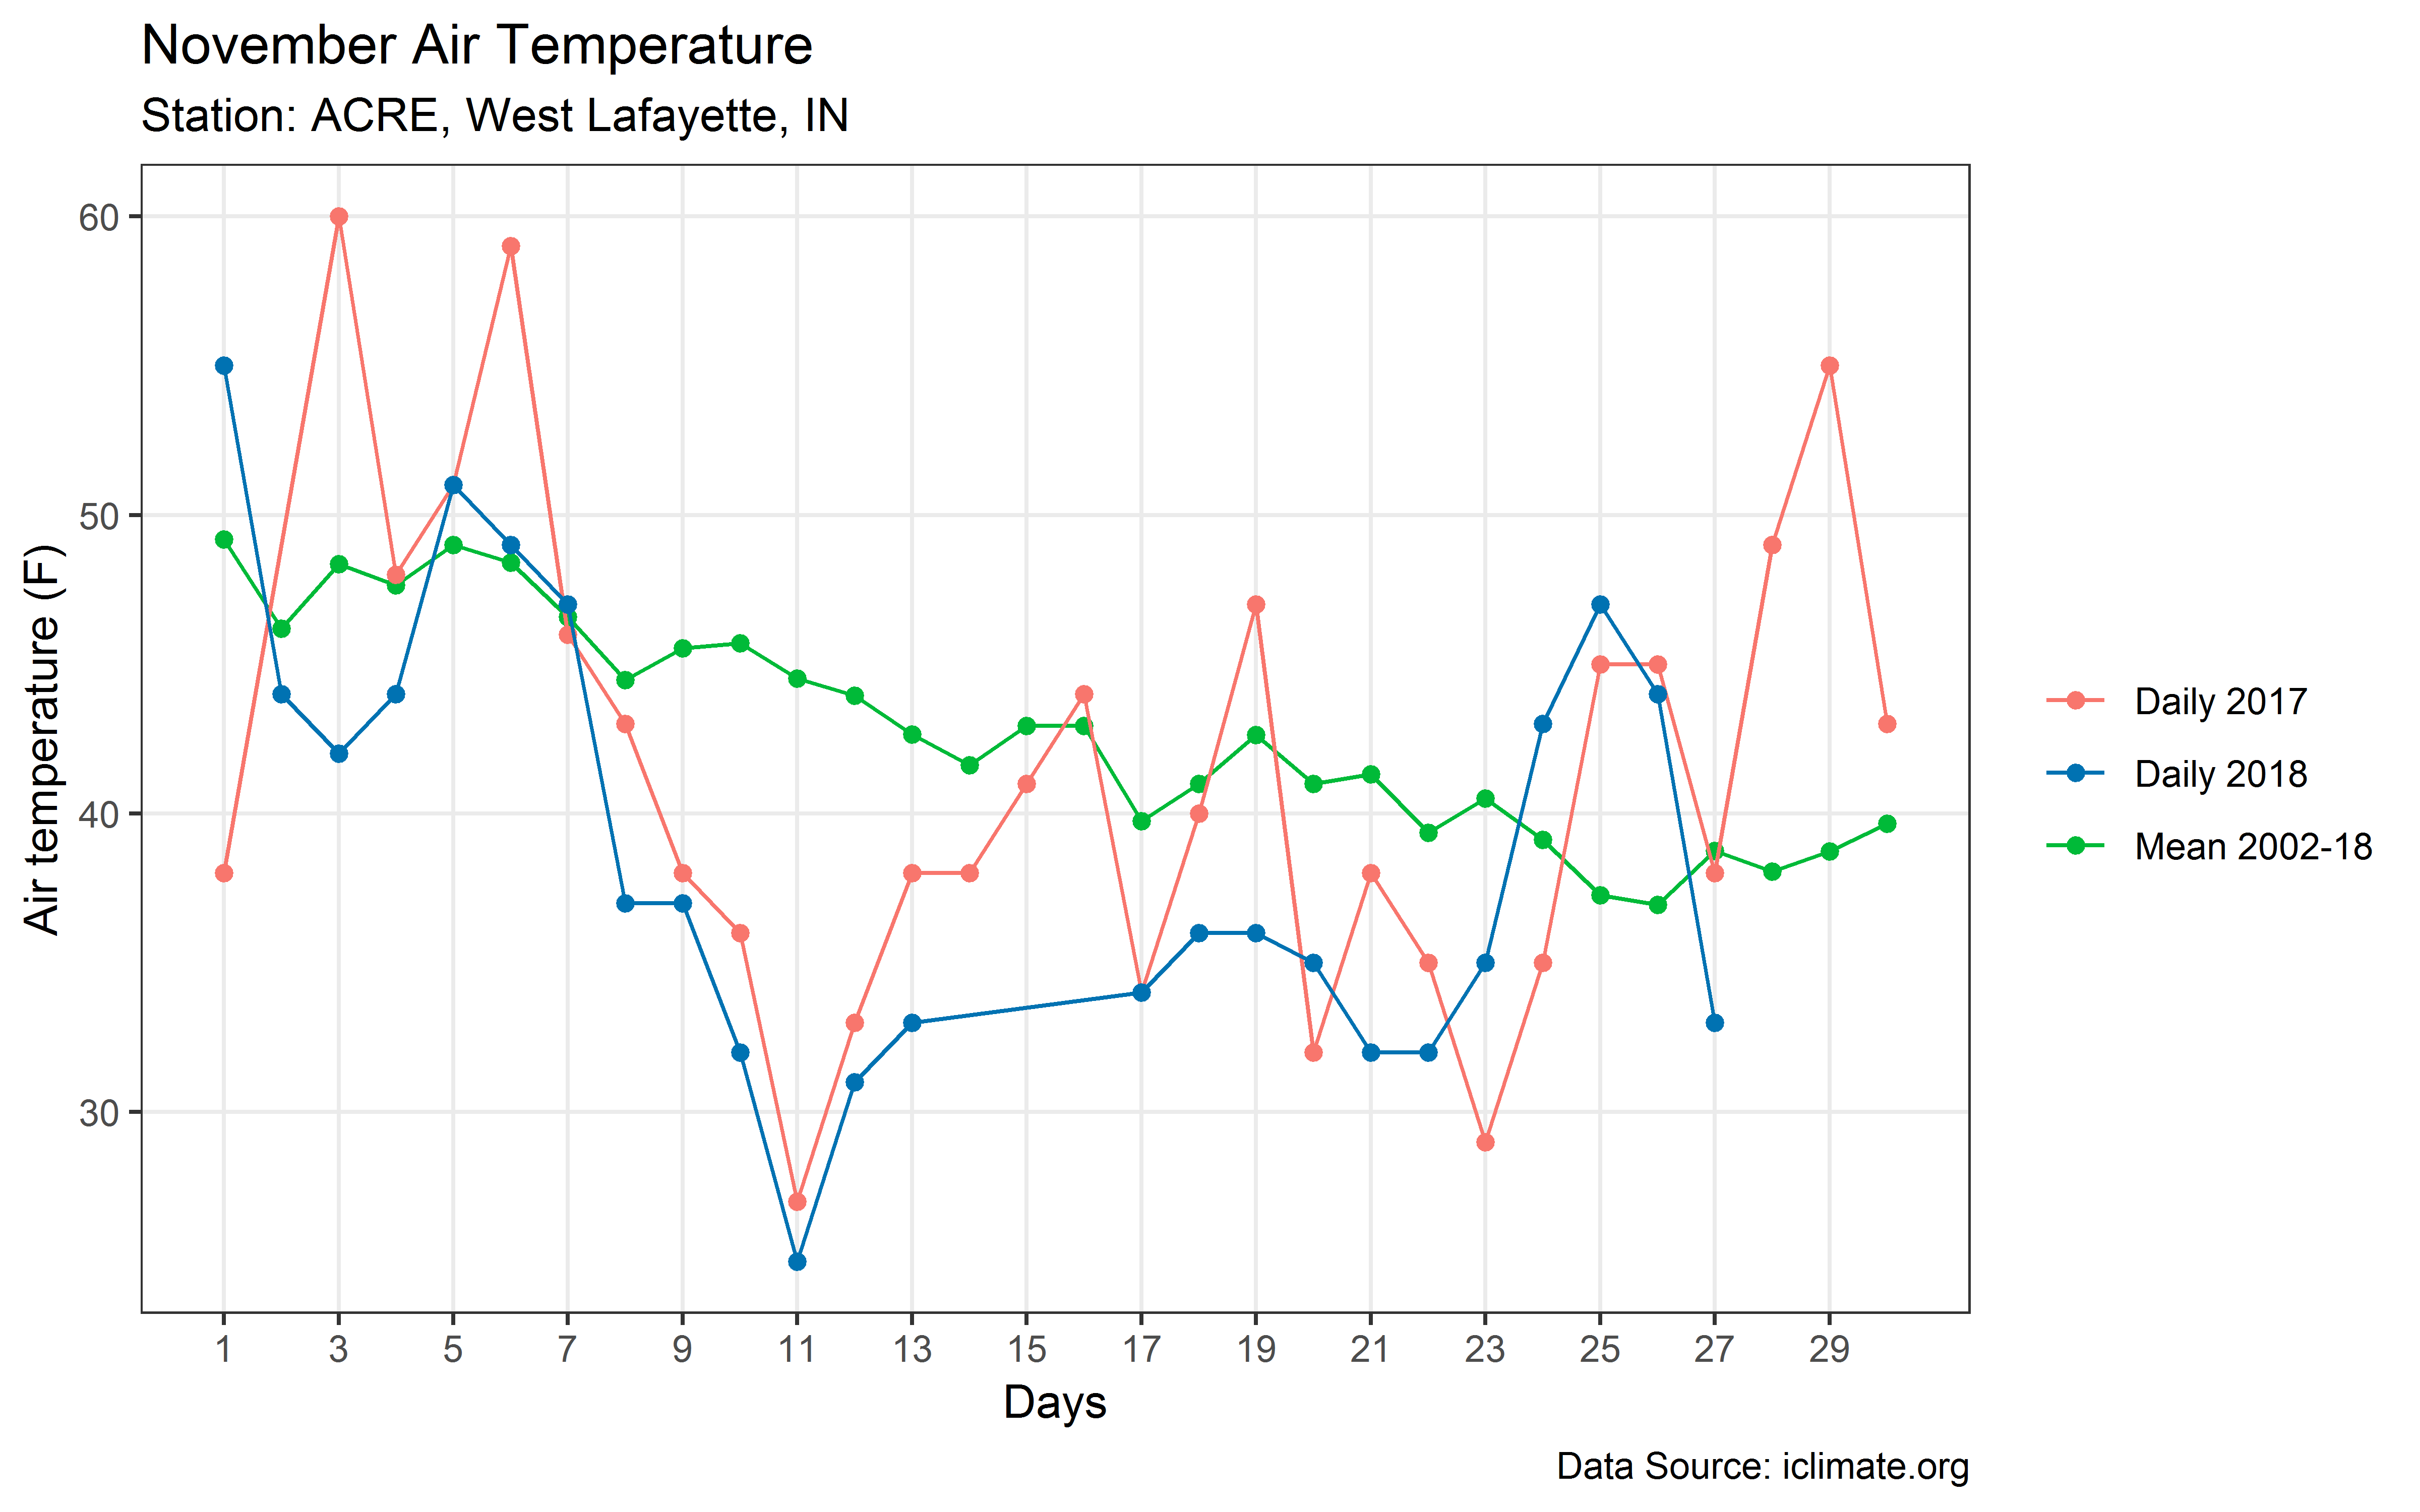
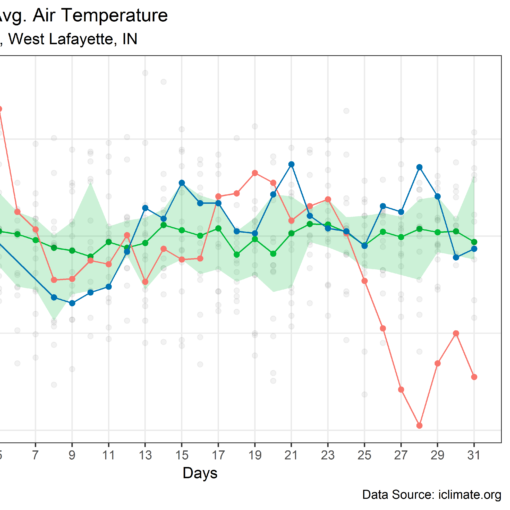
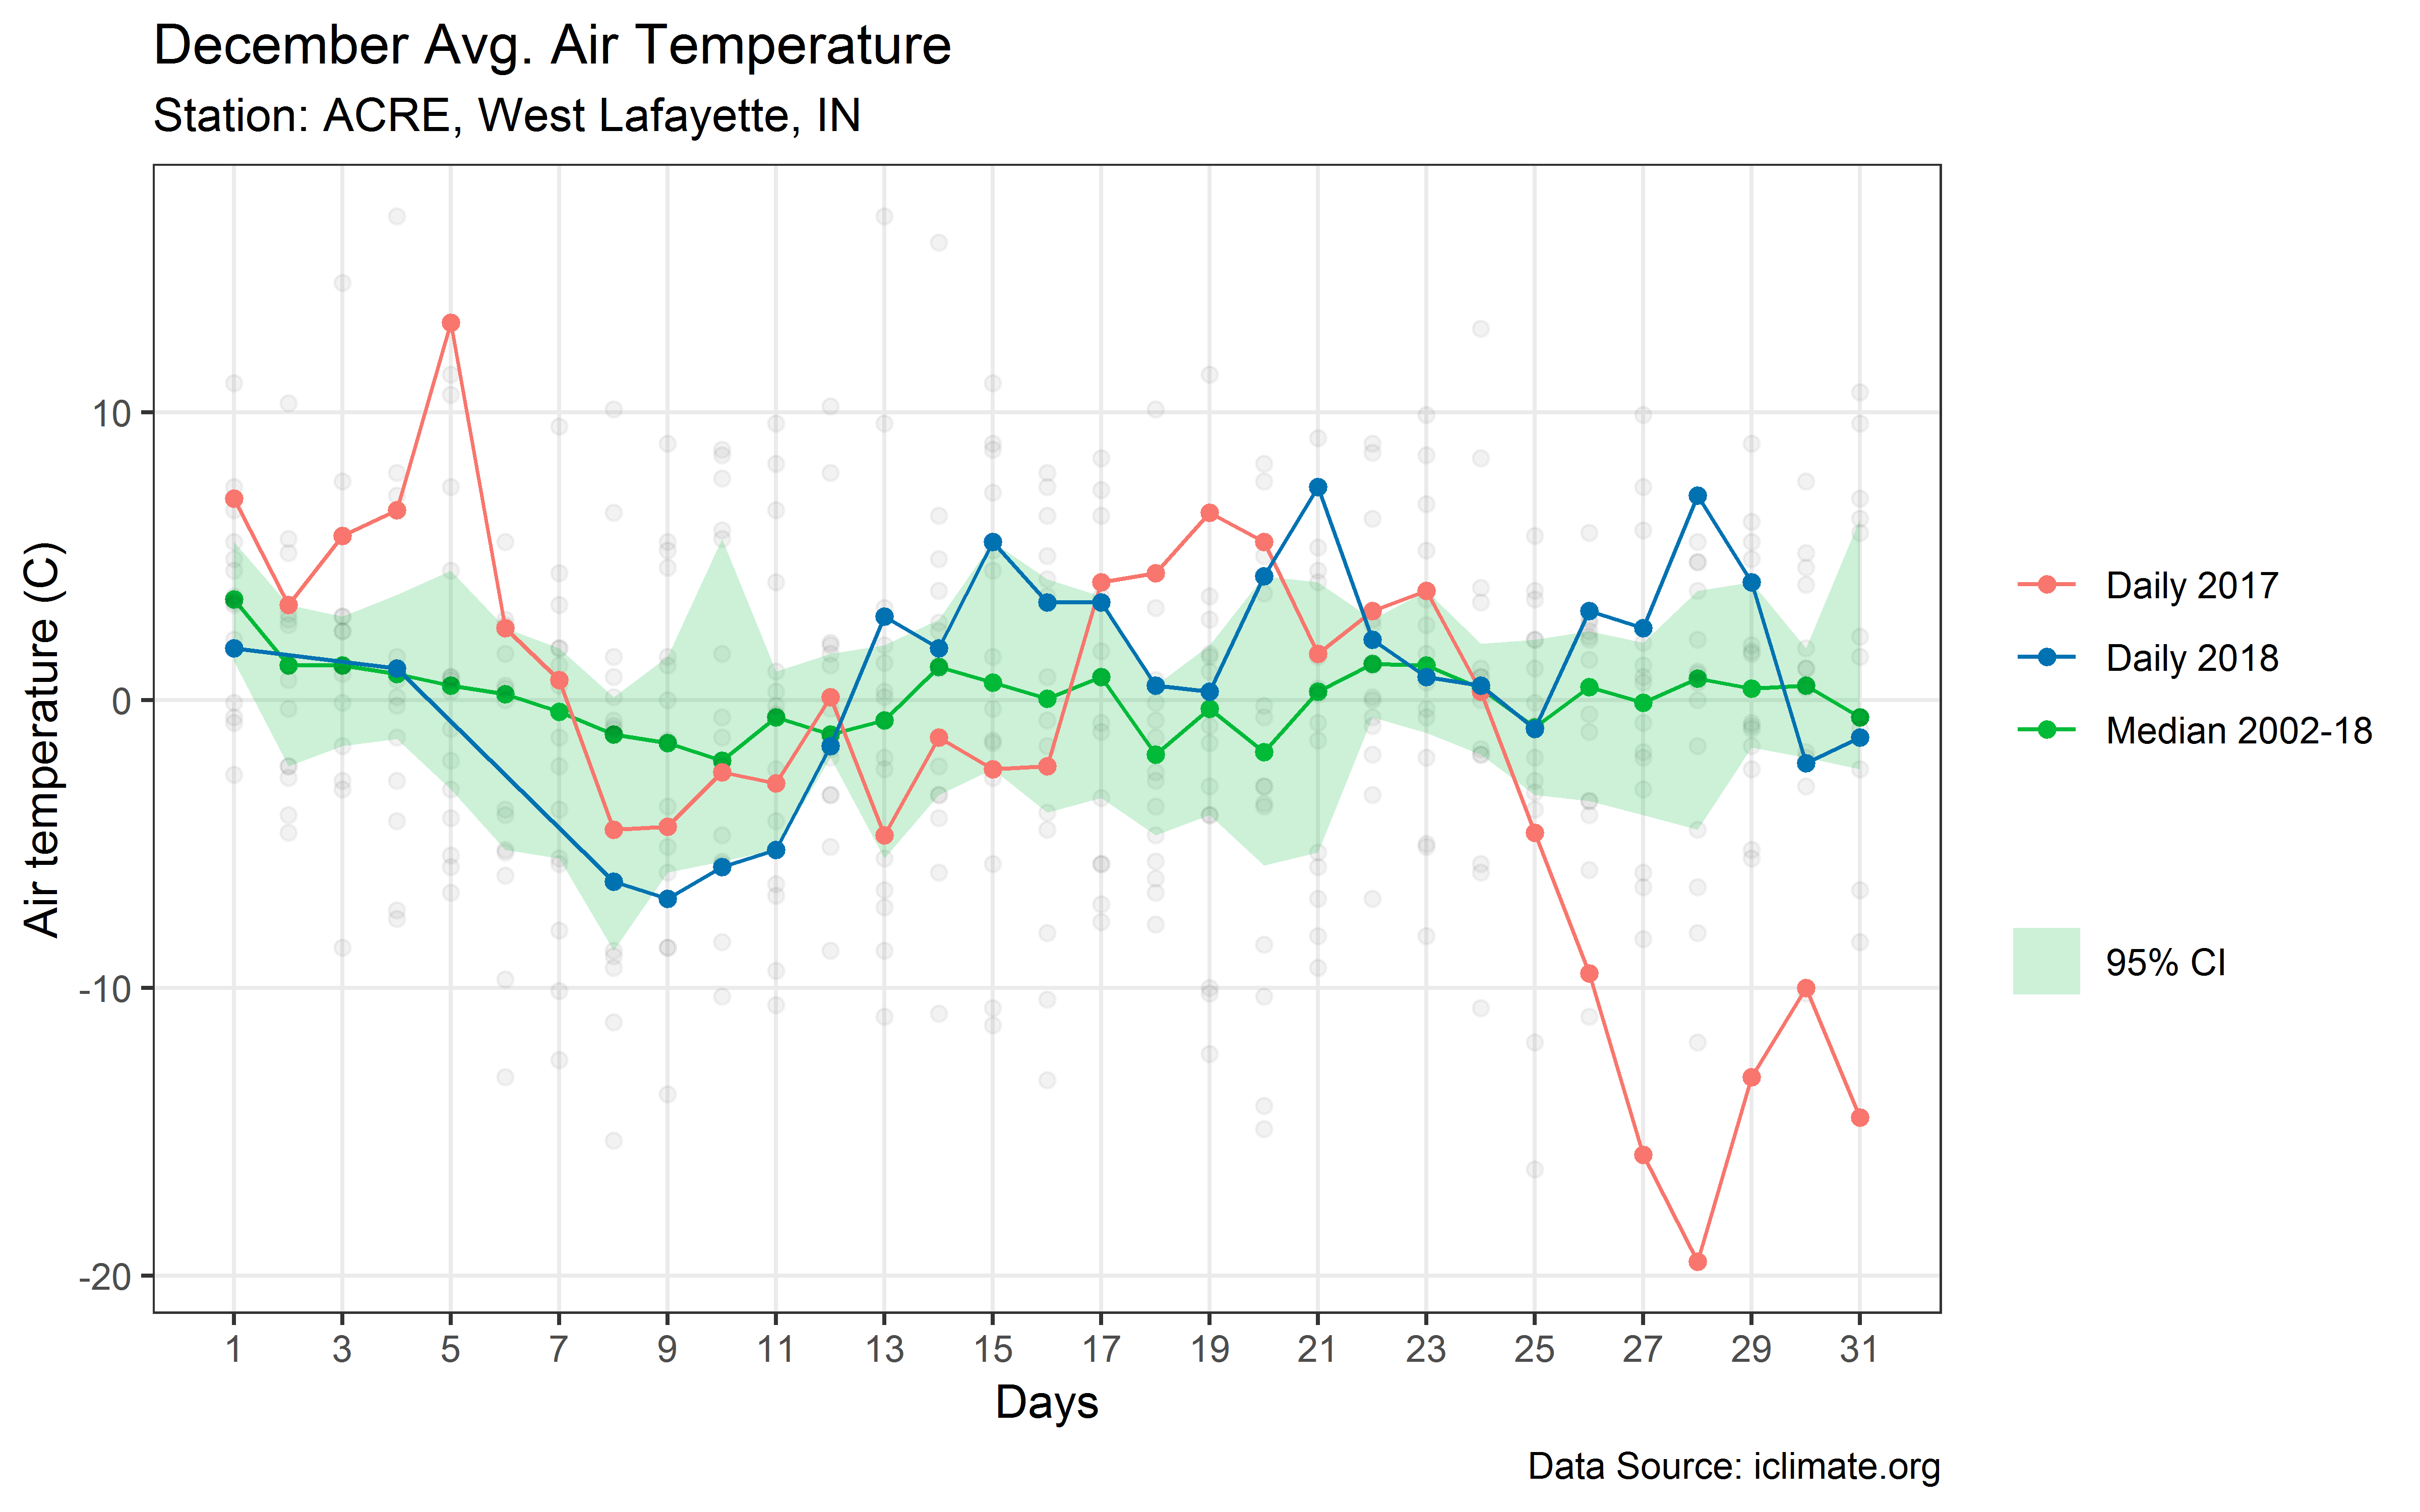
The air temperature data is from ACRE station, in West Lafayette, IN. The data was downloaded from iclimate.org. I want to acknowledge that there are some days with no temperature observations (e.g., 14th, 15th, and 16th Nov), and this can be seen clearly in the plot (no markers). No efforts were made to fill the missing values either through interpolation or kriging from nearby stations that may have data for days with missing data. Note, that this is not a rigorous analysis, but sort of fun exploratory study.
The plot suggests that air temperature was indeed below long-term mean (2002 – 2018, restricted due to data available at this station; ideally we use 30-year records to compute long-term mean) from November 8th to 23rd. The mean temperature for Nov 2018 (considering missing days, and data up to November 27th) is 38.9 F, compared to 41.5 F during November 2017 and 42.8 F considering long-term November records.
November Air Temperature at Climate Division Level
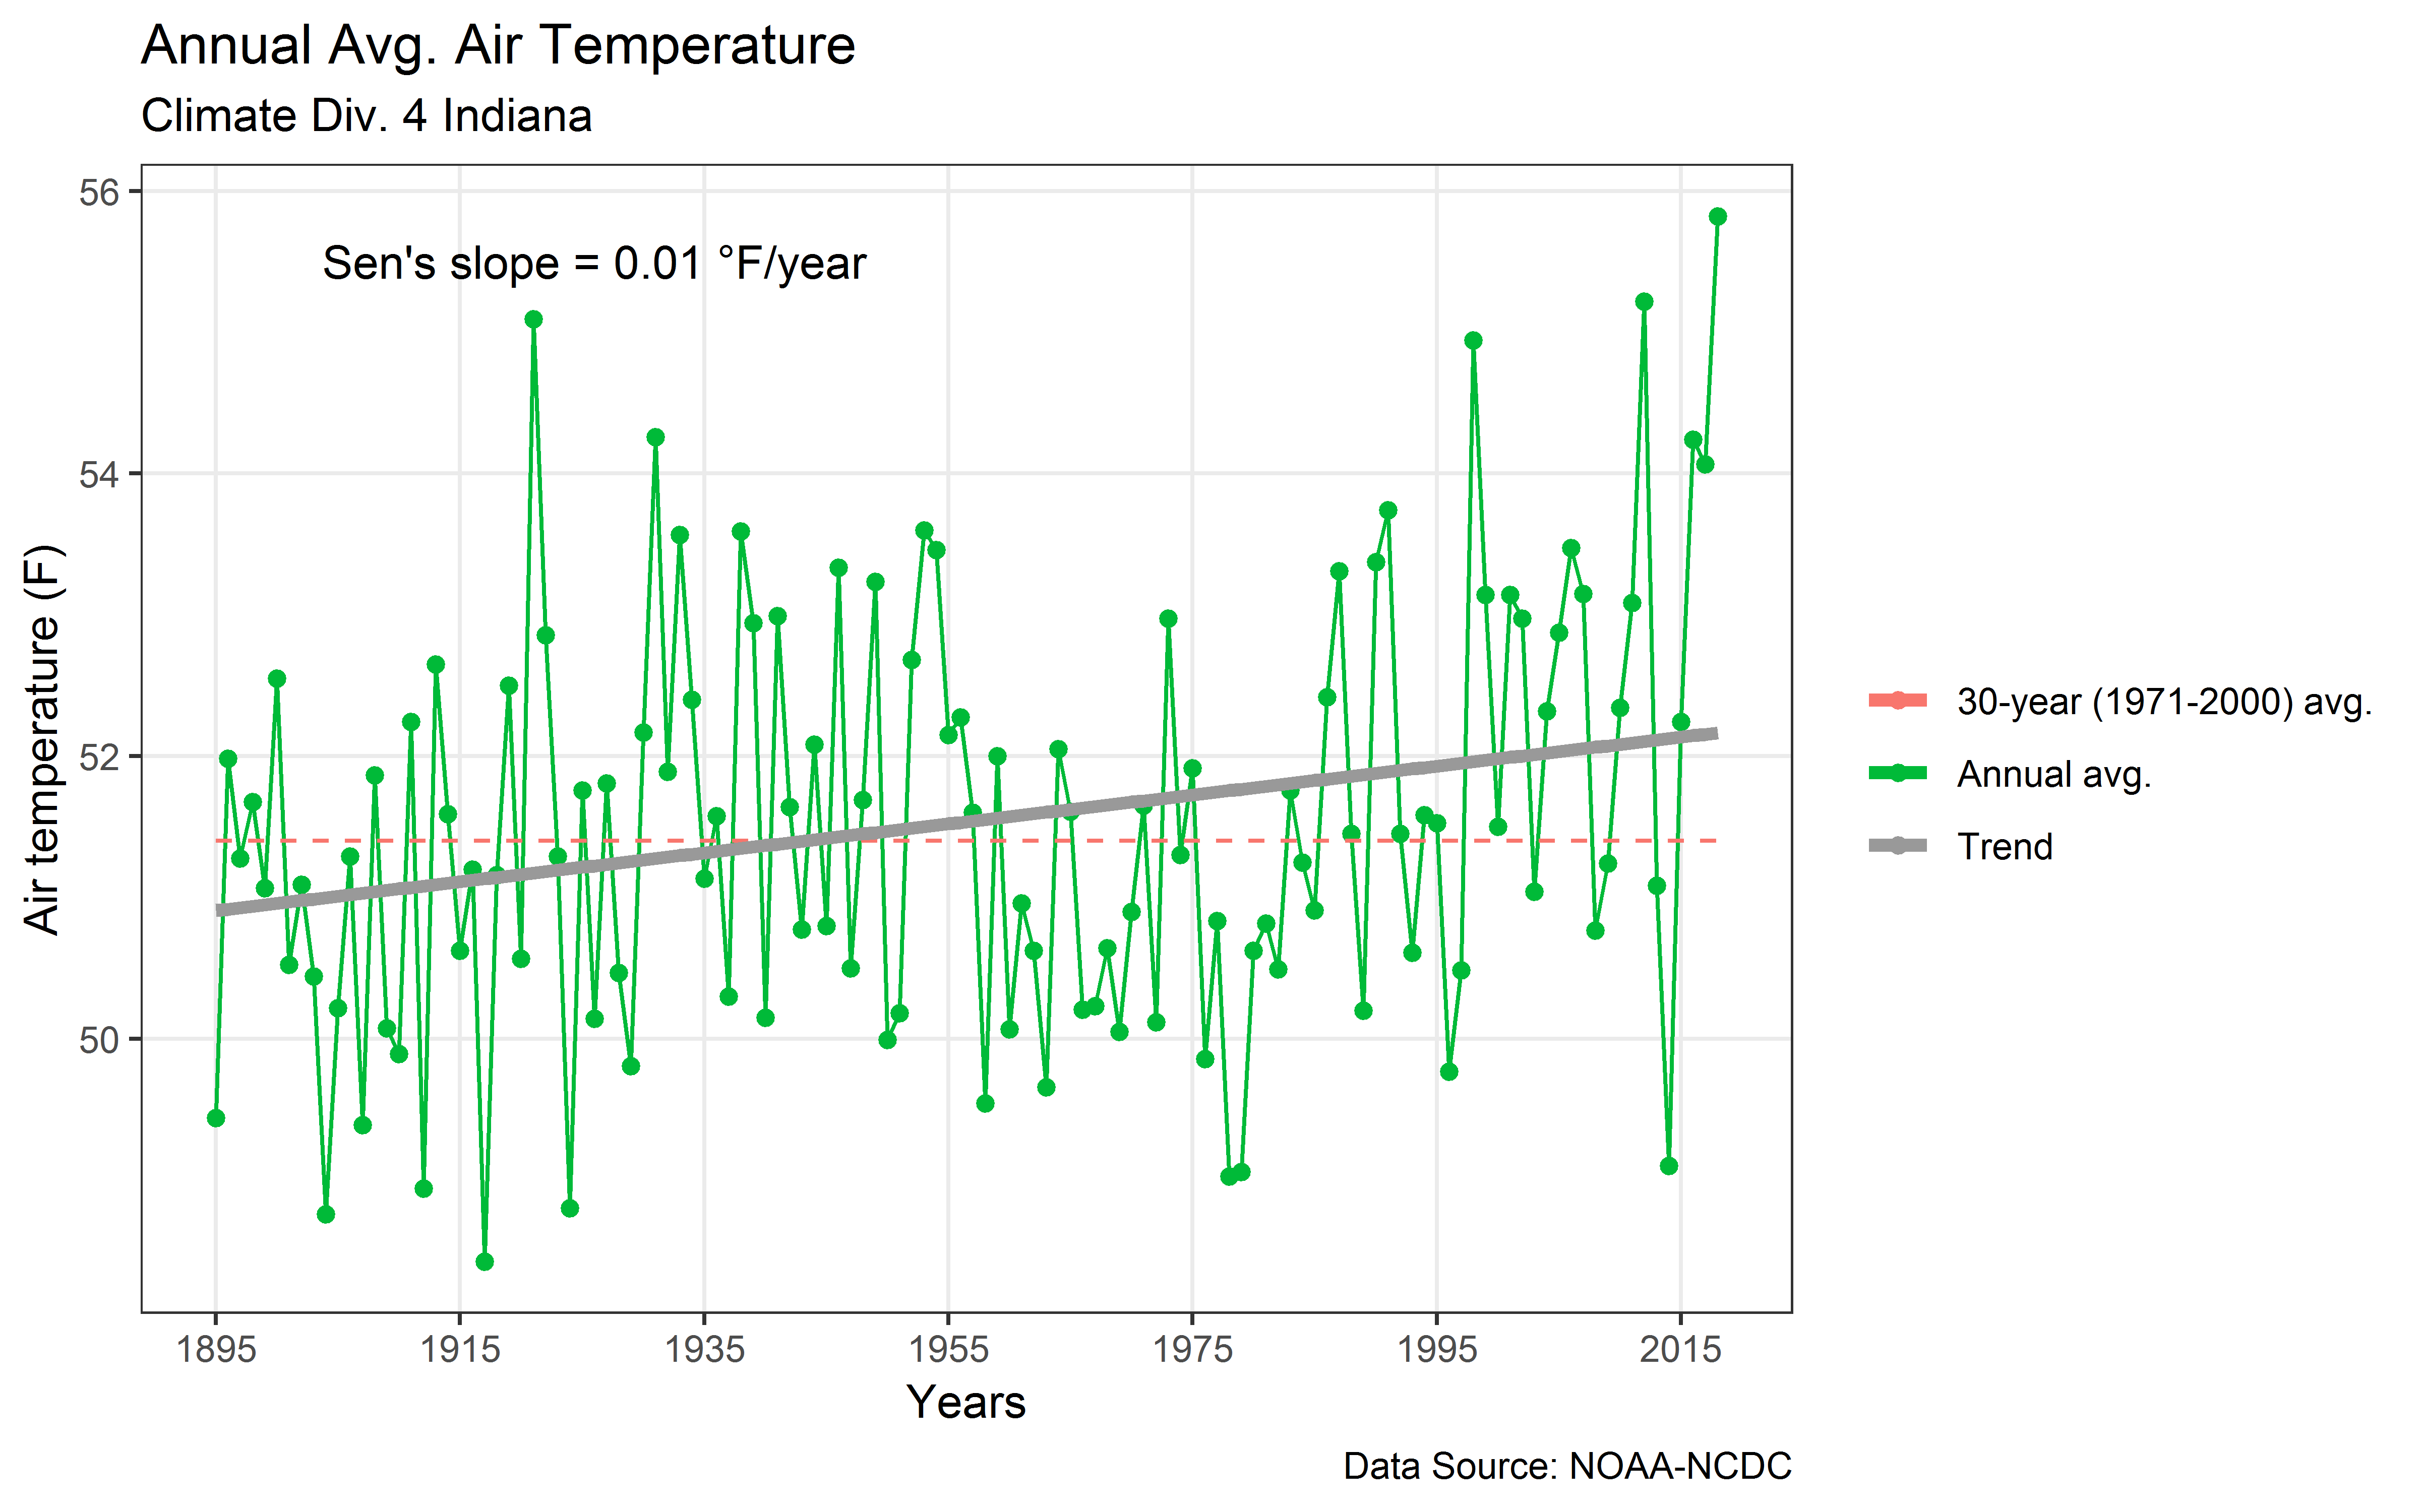
I was not satisfied at this point, because the time series was too short for my liking. I then downloaded climate division level data from NOAA-NCDC. More specifically, I focussed on data over climate division 4 of Indiana, which includes the city of West Lafayette. The period of data availability was from 1895 to the present. The figure above shows the plot of time-series of annual average (Jan. to Dec.) temperature over the entire study period, along with 30-year (1971-2000) mean. A Mann-Kendall trend test indicated that the trend was significant at 5% significance level, with a Sen’s slope estimate of 0.01 F/year. From this plot, we can conclude that there is a positive trend in annual average air temperature over the region.
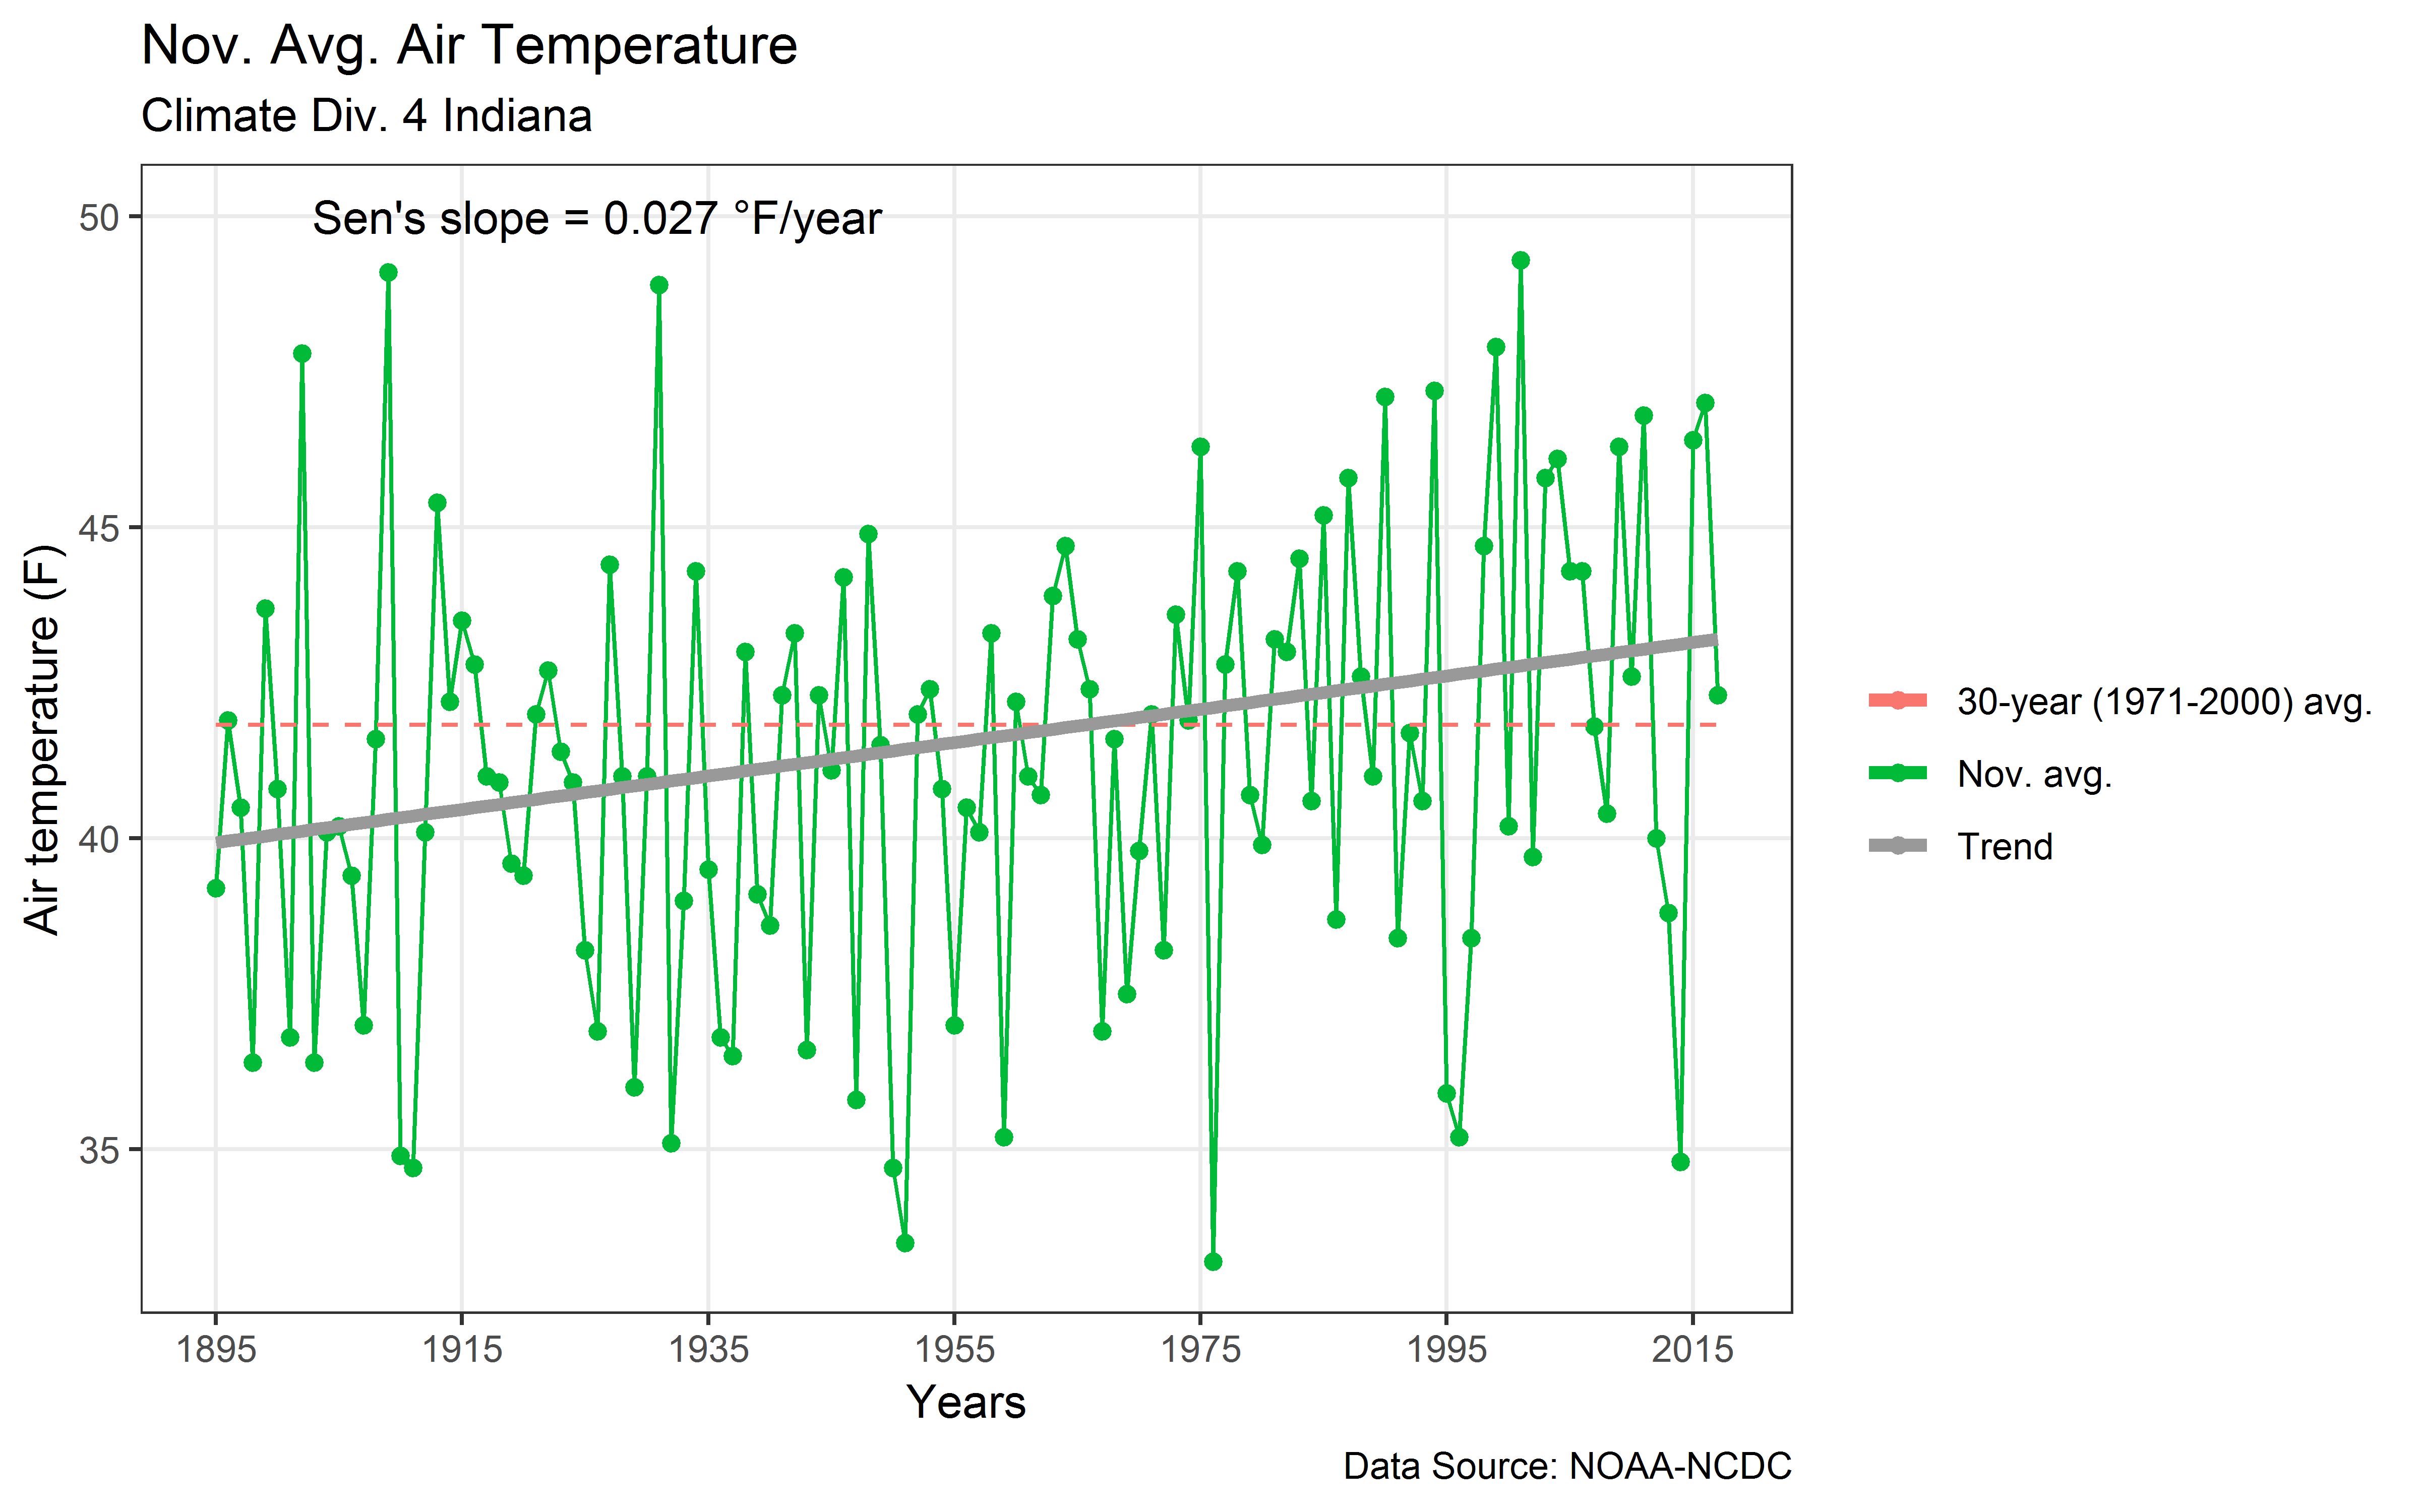
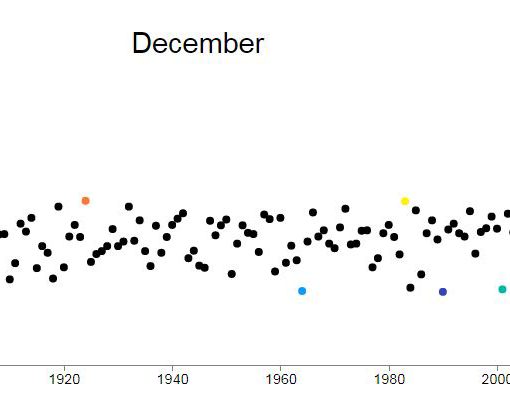
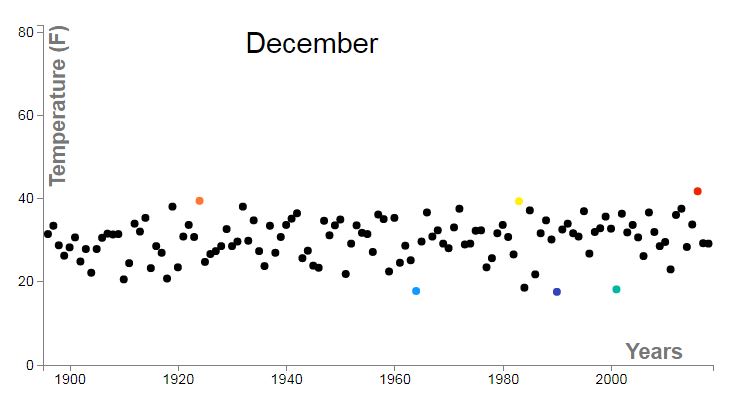
The figure above shows the time series of November temperatures over climate division 4 in Indiana. Data record length is from 1895 to 2017, as data for November 2018 is not available yet. The 30-year (1971-2000) mean is shown as a red dashed line, and the Mann-Kendall trend test indicates a significant positive trend (at 5% level) in November air temperatures with a Sen’s slope (thick grey line) estimate of 0.027 F/year.
The brief study presented here shows that we can explain both short- and long-term climate variability by looking at data. The data preprocessing for NOAA-NCDC climate division data was done in Matlab, and further processing, trend analysis, and plots were performed using R. All the codes used in this post are available on Github, so do check it out!
If you use the material/media/images provided in this post for your school, academic work, news media, or social media, I encourage you to cite this post as follows:
Mallya, Ganeshchandra. “November 2018 Air Temperatures.” Towards Open Science, 11/28/2018, www.gmallya.com/november-2018-air-temperatures.