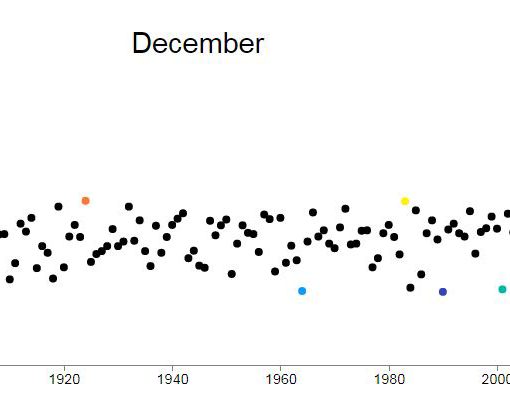
Today, we will take a glance at the December 2018 Air Temperatures in West Lafayette, IN, the home of Purdue University. I have been living in this beautiful college town for the past several years, and I felt that the holiday week (Dec. 24 to Dec. 31, 2018) has been unusually warm compared to the past.
I am not really complaining, because it did give me a chance to go out with my family
#Shutdown Story
My goal for today’s post was to look at both station-level temperatures as well as temperature variations over climate divisions over Indiana. Unfortunately, I was not able to access the updated daily temperature records at climate division level due to #GovernmentShutdown, and this has been my #shutdown story.
Data – Daily Air Temperatures
Therefore, I had to settle down to analyzing station-level temperature records. Data was downloaded for the ACRE station in West Lafayette, IN and daily Average-, Maximum-, and Minimum-air temperatures for December 2018 were compared with past records.
Analysis – December Air Temperatures
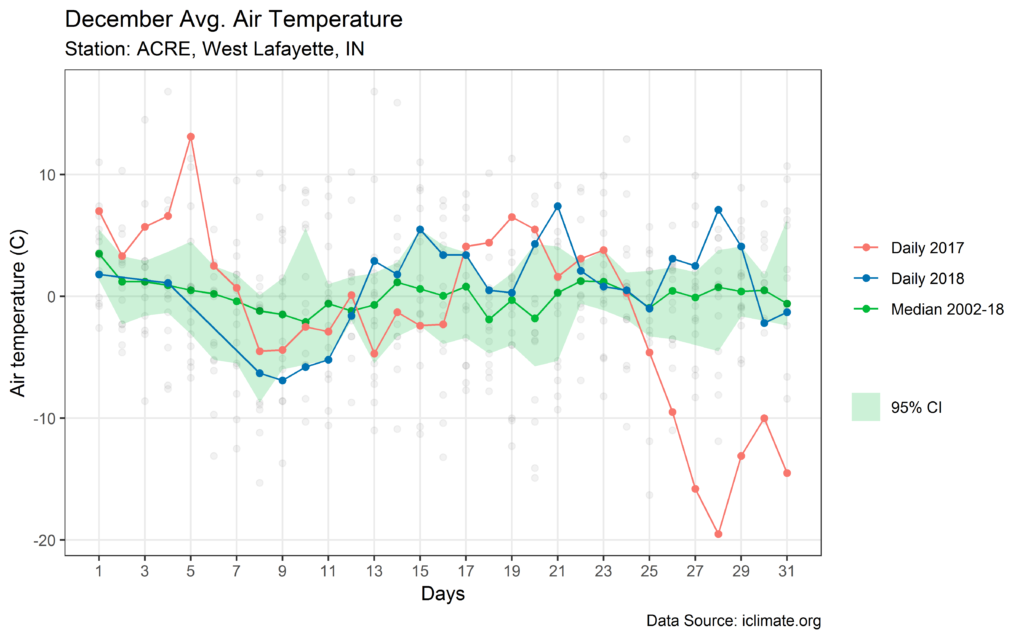
In the above figure, the x-axis represents the days of the month (31 days in December). Daily Average Air Temperatures (in degree Celsius,
The median values suggest that the average temperature for December hovers around zero degree Celsius. The last week of December 2017 was extremely cold, with several record-cold days [1] leading up to the New Year. Comparatively, the second-half of December 2018 has been
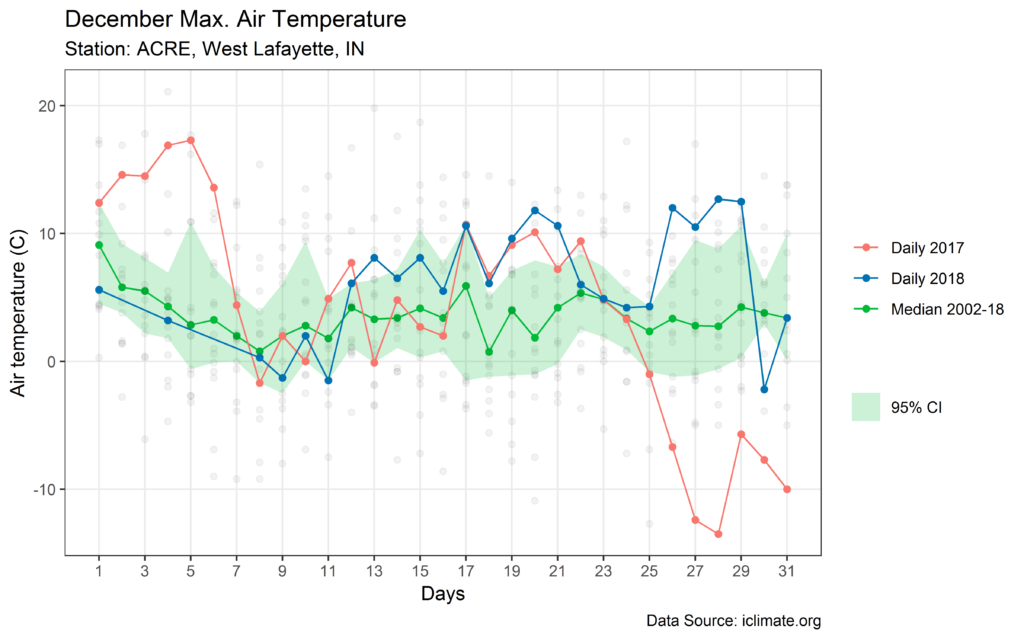
To get a complete perspective of temperature variation during December, maximum and minimum air temperatures were also analyzed. The figure above shows daily during the period 2002-2018 along with the median values and its 95% confidence interval. Maximum air temperature records were broken on the 26th, 28th, and 29th of December 2018. During the same period in December 2017 (i.e., 26th to 31st), records were broken at the lower spectrum of maximum temperatures indicating extremely cold holiday-week [1].
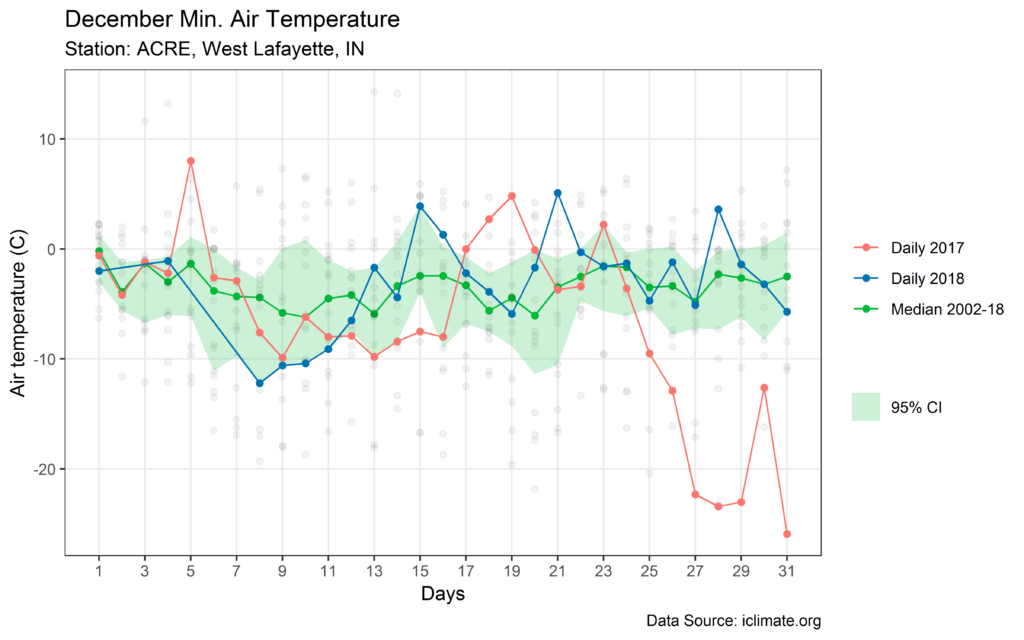
The figure above shows the comparison of daily minimum air temperatures with historic median values [1]. During December 2017, minimum air temperature records along the lower limits were broken on the 27th, 28th, 29th, and 31st, indicating extreme cold days. On the other hand, the data for December 2018 indicates that minimum air temperatures were close to the median, except for 28th December 2018 when it was a record for that day along the upper limits [1].
Open Science and how to cite:
The code for this post is available on Github, so do check it out!
If you use the material/media/images provided in this post for your school, academic work, news media, or social media, I encourage you to cite this post as follows:
Mallya, Ganeshchandra. “December 2018 Air Temperatures.” Towards Open Science, 01/01/2019, https://gmallya.com/december-2018-air-temperatures/.
Footnotes:
[1] based on 16-year data record, i.e., 2002-2018


